

The Value of Data
- Data is useless; insights are what matter: Data itself has no value. The key is to identify problems from it and transform those findings into strategies that improve performance or conversion rates.
- Short-term data is only a reference; focus on long-term trends: A single data point often fails to reveal the full picture. Only long-term trends can demonstrate true value.
GA4 Reports Overview
GA4 provides reports in the following four core areas:
- Acquisition: Understand how users arrive at your website.
- Engagement: Analyze user behavior and interactions on the site.
- Monetization: Track website revenue (requires an engineer to implement advanced e-commerce code).
- Retention: Analyze the ratio of new to returning customers.
Report Interpretation Guide
Understanding Top-Selling Products
- Daily sales performance of top-selling products.
- A list of high-volume, low-profit products.
- Compare sales rates and view rates to identify issues.
Traffic Source Analysis
- Effectiveness of ad-driven traffic.
- Traffic contribution from external sites like social media and forums.
- Trends in organic traffic.
- Use source data to analyze visitor performance from different countries and regions, identifying high-potential markets for focused promotion.
E-commerce Reports
E-commerce Conversion - Abandonment
- Cart abandonment: The percentage of users who add items to their cart but do not complete the purchase.
- Checkout abandonment: The percentage of users who start the checkout process but do not complete the purchase.
Returning Customer Analysis
- High-value vs. low-value returning customers
- New customers who made only one purchase
High-Value Actions
- Users who clicked on internal promotions but did not purchase.
- Users who searched for products but did not purchase.
- Users who watched videos but did not purchase.
P.S. If you find that the monetization amount in GA4 is 0, an engineer needs to implement e-commerce events to send order information to GTM, which then forwards the data to GA.
Conversion Rate
Conversion rate is a key performance indicator (KPI) for e-commerce websites, used to measure the proportion of visitors who complete a target action. The most common is the order conversion rate.
Formula:
Conversion Rate = Number of Conversions / Total Number of Visits
Example:
- Number of Orders: 3834
- Sessions (Number of Visits): 347311
3834 / 347311 = 0.011
Besides order conversion rate, you can also monitor the following metrics:
- Purchase conversion rate
- Registration conversion rate
- Click conversion rate
- Page conversion rate
- Add-to-cart conversion rate
Custom Events and Goal Setting
GA4 offers powerful customization features, allowing users to set goals for specific actions and conversions, including:
- Tracking user behavior: Such as button clicks, video views, form submissions, etc.
- Funnel conversion analysis: Custom events can help build conversion funnels to analyze user drop-off at each stage.
- Measuring content interaction: Track article read completion, scroll depth, etc., to optimize content strategy.
- Monitoring web page traffic: Such as visits to promotion pages and watched product pages.
- Automated goal monitoring: Set custom events as goals to enable automated reporting for key conversion actions.
- Multi-platform data integration: Unify tracking for similar events on both apps and websites to achieve cross-platform analysis.
Setting Goals for Specific URLs
- Goal: Understand the performance of a specific URL or page.
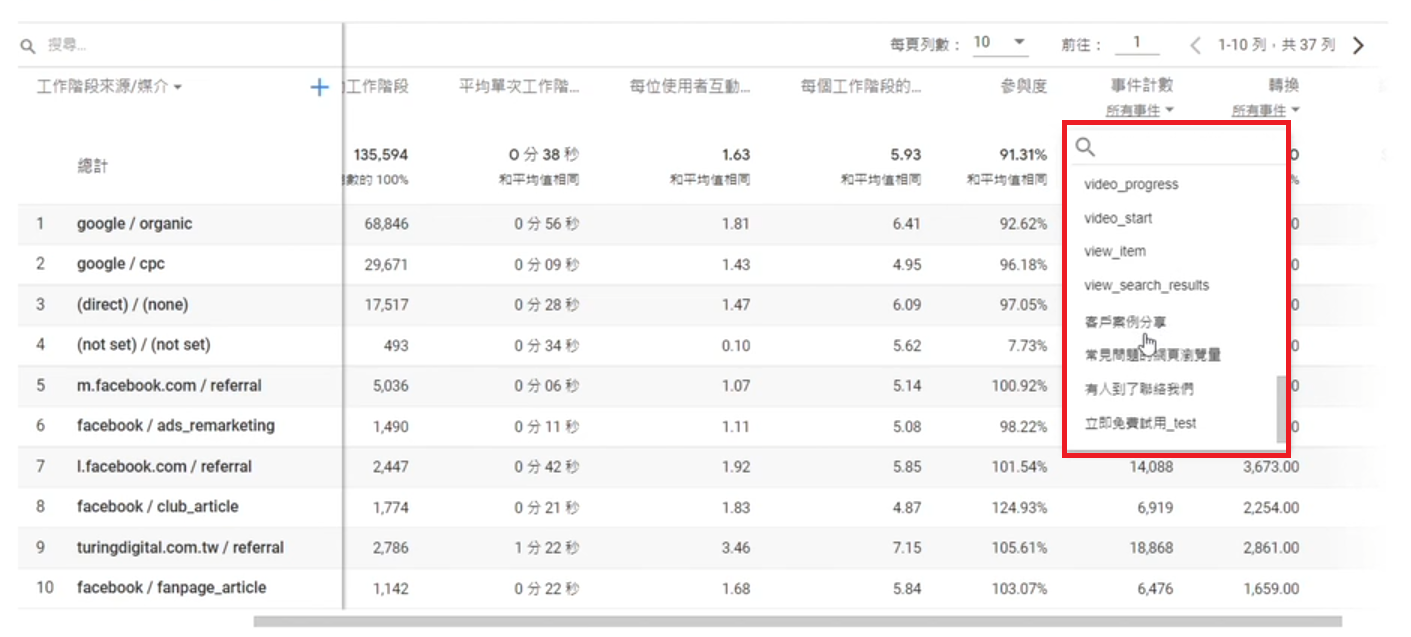
- Set up a custom event to track the number of visits to a specific page.
Example:
Ad Performance Metrics
Interpreting Key Metrics
- CPC (Cost Per Click): The cost for each click, used to measure the cost of driving traffic.
- CPA (Cost Per Action): The cost for each action, focusing on conversion costs.
- CTR (Click Through Rate): The click-through rate, reflecting the attractiveness of an ad.
- ROAS (Return on Ad Spend): The return on ad spend.
ROAS is a very important metric. This number represents how many dollars you earn for every dollar invested in advertising.
Example:
- Ad Spend: $10,000
- Ad Revenue: $50,000
50,000 / 10,000 = 5
Finally
We have designed a series of custom reports for different business needs to help you gain deeper insights into customer behavior and website performance:
-
Shopping Cart Abandonment Rate Analysis
Explore cart abandonment scenarios and their causes to find optimization opportunities. -
Scroll Depth Tracking
Understand the level of user interaction on the site to evaluate content appeal. -
High Bounce Rate Page Ranking
Identify the pages users most frequently exit from and analyze areas for improvement. -
Customer Search Behavior Report
Track customer search queries on the site to identify popular keywords. -
Order Analysis by Time of Day
Identify peak sales periods to inform marketing strategies. -
Order Conversion Rate Tracking
Evaluate conversion efficiency to optimize the sales process. -
Login Method Preference Analysis
Understand customers' preferred login methods (e.g., Normal, Discord, Google). -
Popular Game Preference Report
Analyze which games customers are most interested in to guide game recommendations.
Additional Notes
- (not set): When "Session source / medium" shows as "(not set)," it means GA4 could not determine the user's source and medium, possibly due to direct URL entry or other reasons.
- If the number of users within a date range is too low, it may prevent reports or explorations from displaying data. P.S. Google Signals will be removed from reporting identity on February 12, 2024.


Comments