
Intro: A Cheap, Practical Monitoring Setup
This post documents my hands-on experience deploying Uptime Kuma, upgrading it to MariaDB, and integrating with the Uptime Kuma Admin API — so you can self-host with confidence and cut your monitoring costs.
Why Choose Uptime Kuma (Cheap and Open Source)
- Commercial monitoring software easily runs into tens of thousands per year
- Uptime Kuma is fully open source, free, and feature-rich enough for most needs
- Setup is dead simple — just run it with Docker
- The community is active, so finding answers to issues is easy
- Highly flexible — easy to customize and extend
Uptime Kuma Architecture in Brief
- Backend: Node.js + SQLite, using Sequelize ORM (you can also swap in MariaDB for better performance)
- Frontend: A web UI built with Vue.js
- Communication: WebSocket for real-time monitor status updates
- Highlights: Self-hosting is trivial, lightweight, and very flexible — you can do whatever you want with it
Performance Bottlenecks We Hit (Deep Dive)
Early Performance Issues
- The default SQLite database starts choking once you accumulate a lot of monitors (around 800 monitors)
- Switching to MariaDB gave a clear performance boost and much better stability
Challenges with Large-Scale Monitoring
After digging into Uptime Kuma's source code, we found a few interesting things. We initially assumed the bottleneck was high-frequency I/O against SQLite, but in actual testing, even after upgrading to MariaDB, the admin UI still struggled to load once the monitor count exceeded 1,000 APIs.
Reading through the code, we realized the bottleneck wasn't really the database layer. The frontend simply wasn't designed with large-scale monitoring in mind, so once you had a lot of monitors, frontend rendering and data handling became the actual bottleneck.
Performance Tuning Suggestions
If you need to monitor a large number of APIs, consider the following:
- Group your monitors logically
- Run multiple Uptime Kuma instances to spread the load
- Periodically purge historical data to keep the database lean
Why Do We Need an Uptime Kuma RESTful API?
Sometimes you want to customize the public status page or programmatically add and manage monitors. That's where a RESTful API comes in handy.
Choosing Active Monitoring
When planning out our monitoring stack, we picked the open-source Uptime Kuma as our active monitoring solution. The catch is that Uptime Kuma doesn't expose a RESTful API out of the box, which limits your ability to automate things.
I eventually found the open-source medaziz11/uptimekuma_restapi package, which solves this elegantly. Under the hood, it simulates a user logging in via WebSocket and wraps those operations as RESTful APIs.
This design lets us automate monitor creation when we ship the second phase next year, which dramatically improves operational efficiency.
How to Enable the RESTful API
Uptime Kuma itself doesn't ship a RESTful API — only a web UI and WebSocket. But you can drop in the third-party medaziz11/uptimekuma_restapi container (already included in the docker-compose.yml above) and manage monitors over plain HTTP.
How does this API package work?
- It logs into the Uptime Kuma web admin using the credentials you provide
- It "simulates user actions" via the internal WebSocket API and exposes those features as a RESTful API
- You just send HTTP requests to this container (like the curl examples below) and it translates them into commands Uptime Kuma understands
- You don't have to write WebSocket code yourself or reverse-engineer Uptime Kuma's internal API
Implementation Details
The clever part of this package is its "user simulation" approach. Specifically:
- WebSocket-based login: The package uses your admin credentials to log into the Uptime Kuma backend over WebSocket
- API wrapping: It wraps operations that would normally go over WebSocket into a clean RESTful API surface
- Automation-friendly: This makes it easy to plug Uptime Kuma into existing automation pipelines
It looks roundabout at first glance, but it's actually a really practical solution — especially when you need to integrate with existing systems.
Docker Compose Example
services:
  kuma:
    image: louislam/uptime-kuma:2.0.0-beta.3
    ports:
      - "3001:3001"
    environment:
      - UPTIME_KUMA_DB_TYPE=mariadb
      - UPTIME_KUMA_DB_HOSTNAME=mariadb
      - UPTIME_KUMA_DB_PORT=3306
      - UPTIME_KUMA_DB_NAME=kuma
      - UPTIME_KUMA_DB_USERNAME=kuma
      - UPTIME_KUMA_DB_PASSWORD=G7p9x2Qw!s
    depends_on:
      mariadb:
        condition: service_healthy
    volumes:
      - uptime-kuma:/app/data

  mariadb:
    image: mariadb:10.11
    environment:
      - MYSQL_ROOT_PASSWORD=R4t8z1Lm@v
      - MYSQL_DATABASE=kuma
      - MYSQL_USER=kuma
      - MYSQL_PASSWORD=G7p9x2Qw!s
    volumes:
      - mariadb-data:/var/lib/mysql
    ports:
      - "3307:3306"
    healthcheck:
      test: ["CMD", "mariadb-admin", "ping", "-h", "localhost", "-u", "root", "-pR4t8z1Lm@v"]
      timeout: 10s
      retries: 10
      interval: 10s
      start_period: 30s

  api:
    image: medaziz11/uptimekuma_restapi
    environment:
      - KUMA_SERVER=http://kuma:3001
      - KUMA_USERNAME=admin
      - KUMA_PASSWORD=G7p9x2Qw!s
      - ADMIN_PASSWORD=F5n3c7Vb$e
    depends_on:
      - kuma
    ports:
      - "8000:8000"
    volumes:
      - api:/db

volumes:
  uptime-kuma:
  mariadb-data:
  api:
Make sure the credentials match across docker-compose, otherwise the API service won't be able to connect properly!
Most Useful RESTful API Calls
1. List All Monitors
curl -X GET 'http://localhost:8000/api/monitors' -H 'Content-Type: application/json'
2. Create a New Monitor
curl -X POST 'http://localhost:8000/api/monitors' \
  -H 'Content-Type: application/json' \
  -d '{
    "friendly_name": "My Site",
    "type": "http",
    "url": "https://example.com",
    "interval": 300
  }'
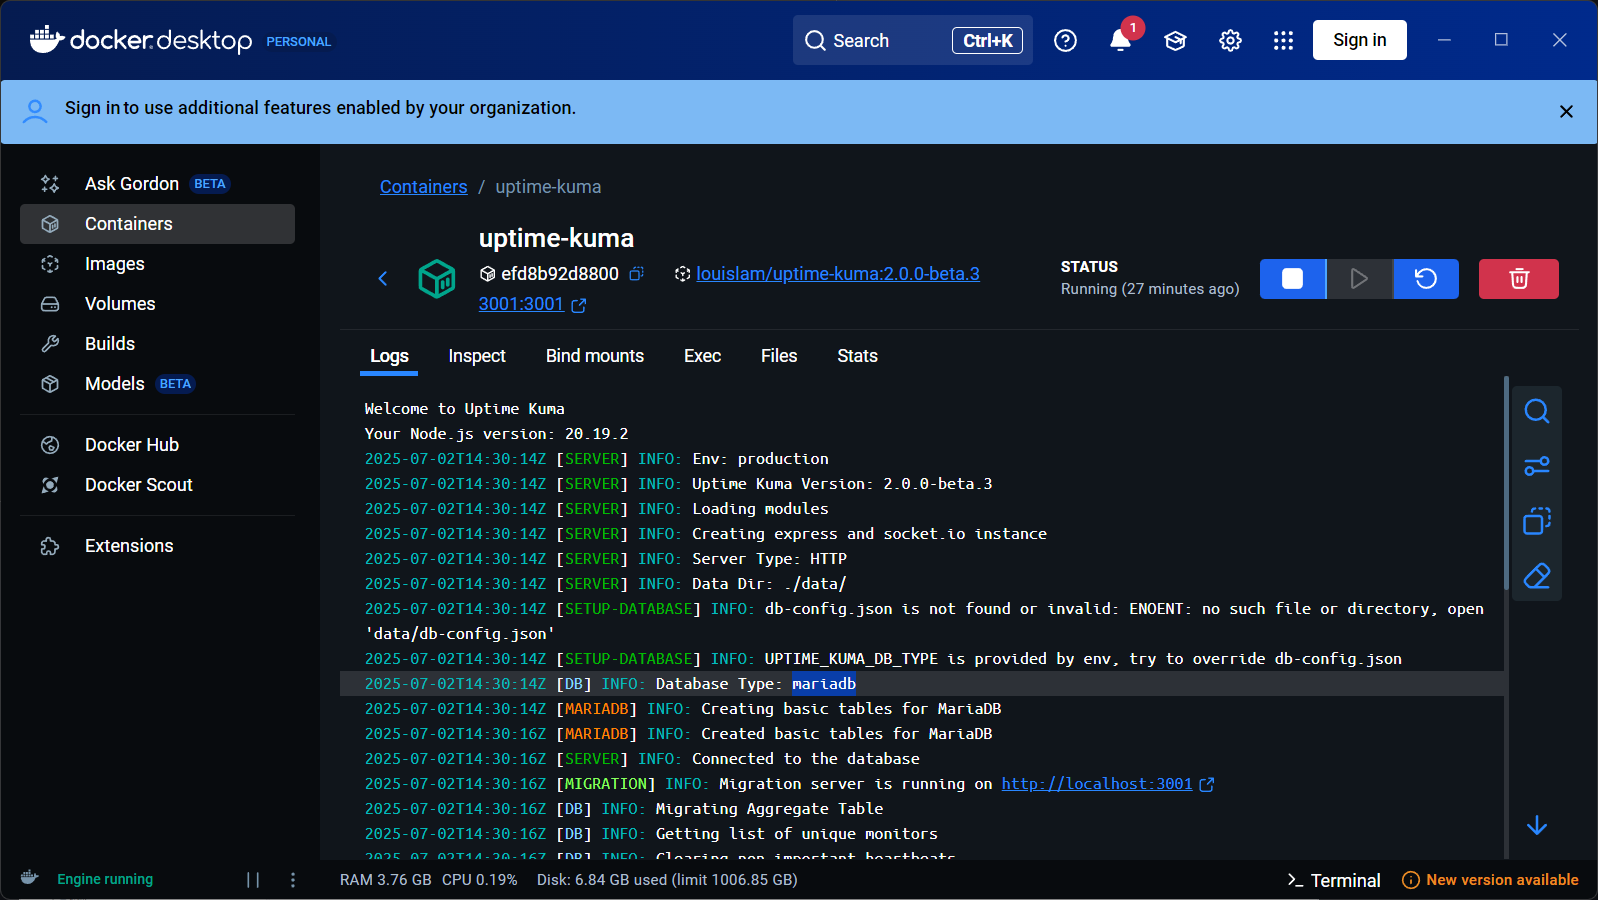
Verify the Migration to MariaDB Worked
Conclusion
Uptime Kuma is a real money-saver, easy to self-host, performs well after switching to MariaDB, and can be automated through the API. Highly recommended for anyone who wants to stay in control of their monitoring without paying a fortune.
Heads up: once you cross 1,000 monitors, the dashboard starts to lag. You may want to spread the load across multiple Uptime Kuma instances, or wait for the upstream project to improve large-scale performance in future releases.
Roadmap
Based on our hands-on experience and performance analysis, here's what we plan for phase two next year:
- Automated monitor creation: Use the RESTful API to automate creating and managing monitors
- Performance tuning: Look into a multi-instance architecture to handle large-scale monitoring needs
- Monitoring strategy refinement: Adjust monitoring intervals and data retention based on real usage
This gives us a stable, reliable monitoring service while keeping costs in check.


Comments