
Introduction
We manage websites for multiple countries and were originally using Seq as our log server. However, since only one person could be logged in at a time and each country required its own container service, we decided to switch to Grafana to simplify operations and maintenance. While learning K8s, I discovered that Grafana, Loki, and Prometheus are a common, standard setup.
First, What is Grafana?
Grafana is an open-source data visualization and monitoring platform that allows you to easily create interactive dashboards to monitor system status in real-time from various data sources. It's primarily composed of the following three services.
- Grafana: This is the visualization platform. It can integrate data from various sources (like Loki and Prometheus) and create charts and dashboards for easy monitoring.
- Loki: This is specifically for collecting and managing log data. When integrated with Grafana, you can analyze logs and monitoring data on the same platform to quickly identify issues.
- Prometheus: Its main responsibility is to collect and store system monitoring metrics, providing a basis for monitoring system health.
Open-Source Logging Services
Based on feedback from several developers online, for a pure logging service, Graylog is a good option for on-premise deployments and is also a great piece of logging software. However, Loki's advantage is that it's lightweight, which can save resources when deploying to the cloud. Loki is also easier to integrate with other products in the Grafana stack.
Next, Deploying the Loki Logging System
docker run -d --name=loki -p 3100:3100 grafana/loki:latest
Loki supports a RESTful API, so we can interact with it using Curl.
Add a Log Entry
# const createdAt = Date.now() * 1_000_000; // js 將計算後的結果貼到這裡 createdAt
@createdAt = 1693022700000000


POST http://localhost:3100/loki/api/v1/push
Content-Type: application/json

{
    "streams": [
        {
            "stream": {
              "app":"nextjs-app" // 可以將你的動態資料放在這,可用來分類、篩選、繪製報表
            },
            "values": [
                ["{{createdAt}}", "write your logs in here"]
            ]
        }
    ]
}
Query Logs
GET http://localhost:3100/loki/api/v1/query?query={app="nextjs-app"}&limit=10
Next, Let's Install Grafana
Run the Grafana Container Service
docker run -d --name=grafana -p 7777:3000 grafana/grafana
Log in to the dashboard. The default username/password is: admin/admin
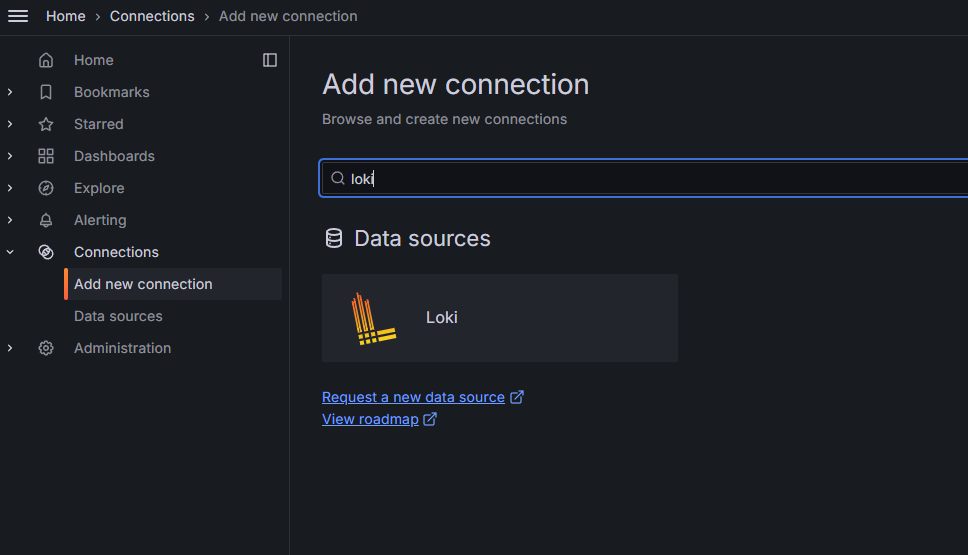
Next, [visit the Grafana dashboard] > Connection > Add new connection > and select the Loki service we created earlier.
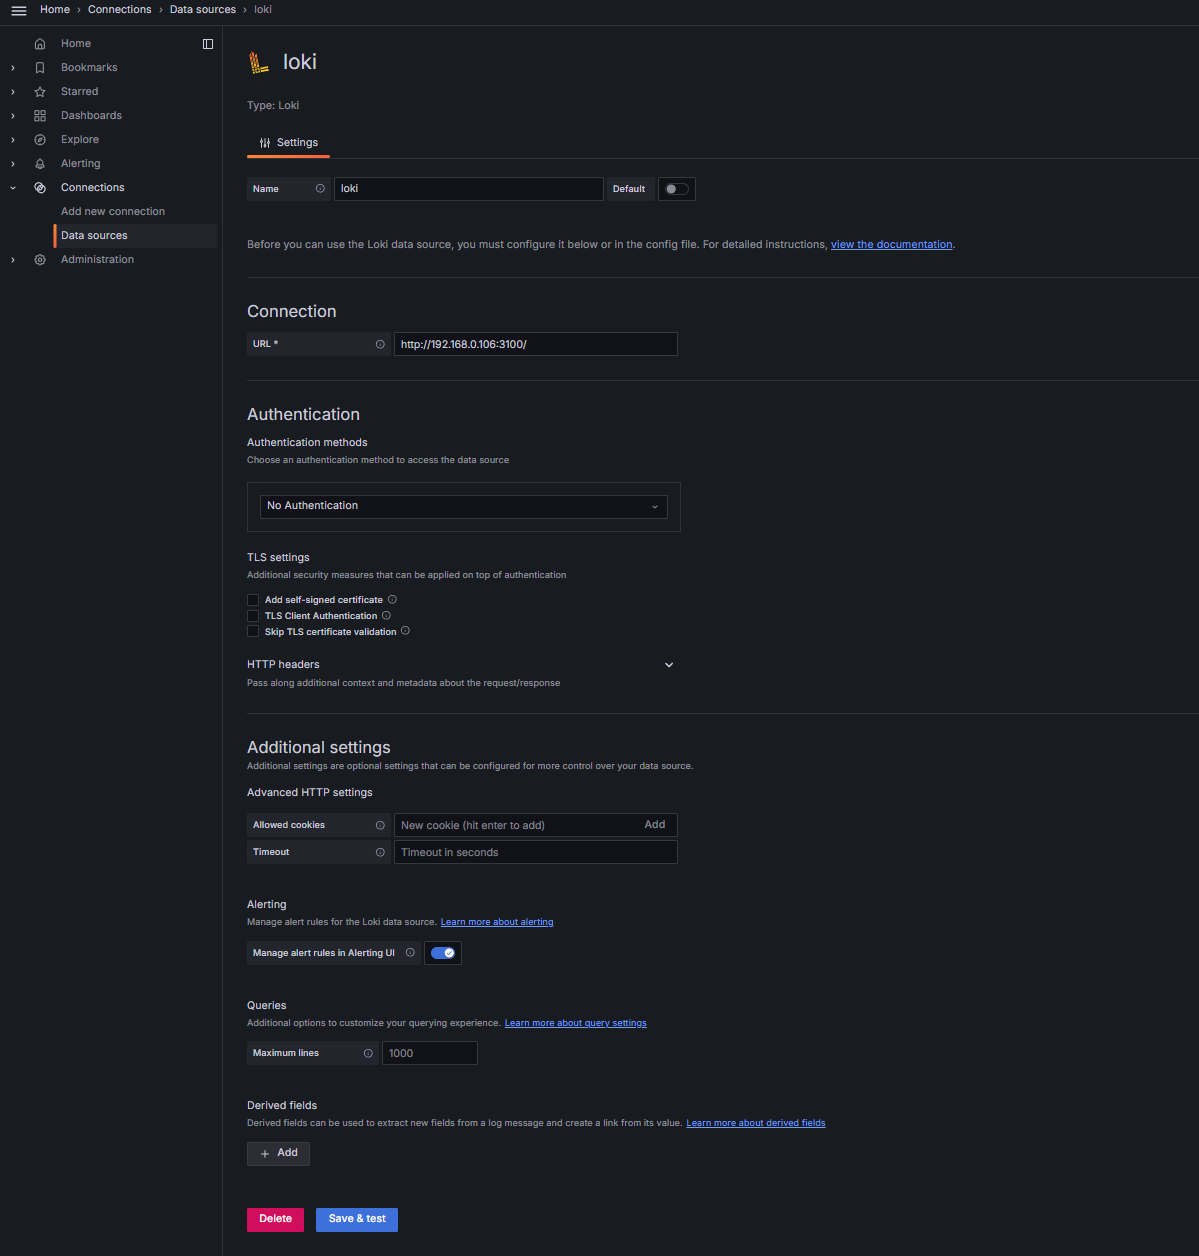
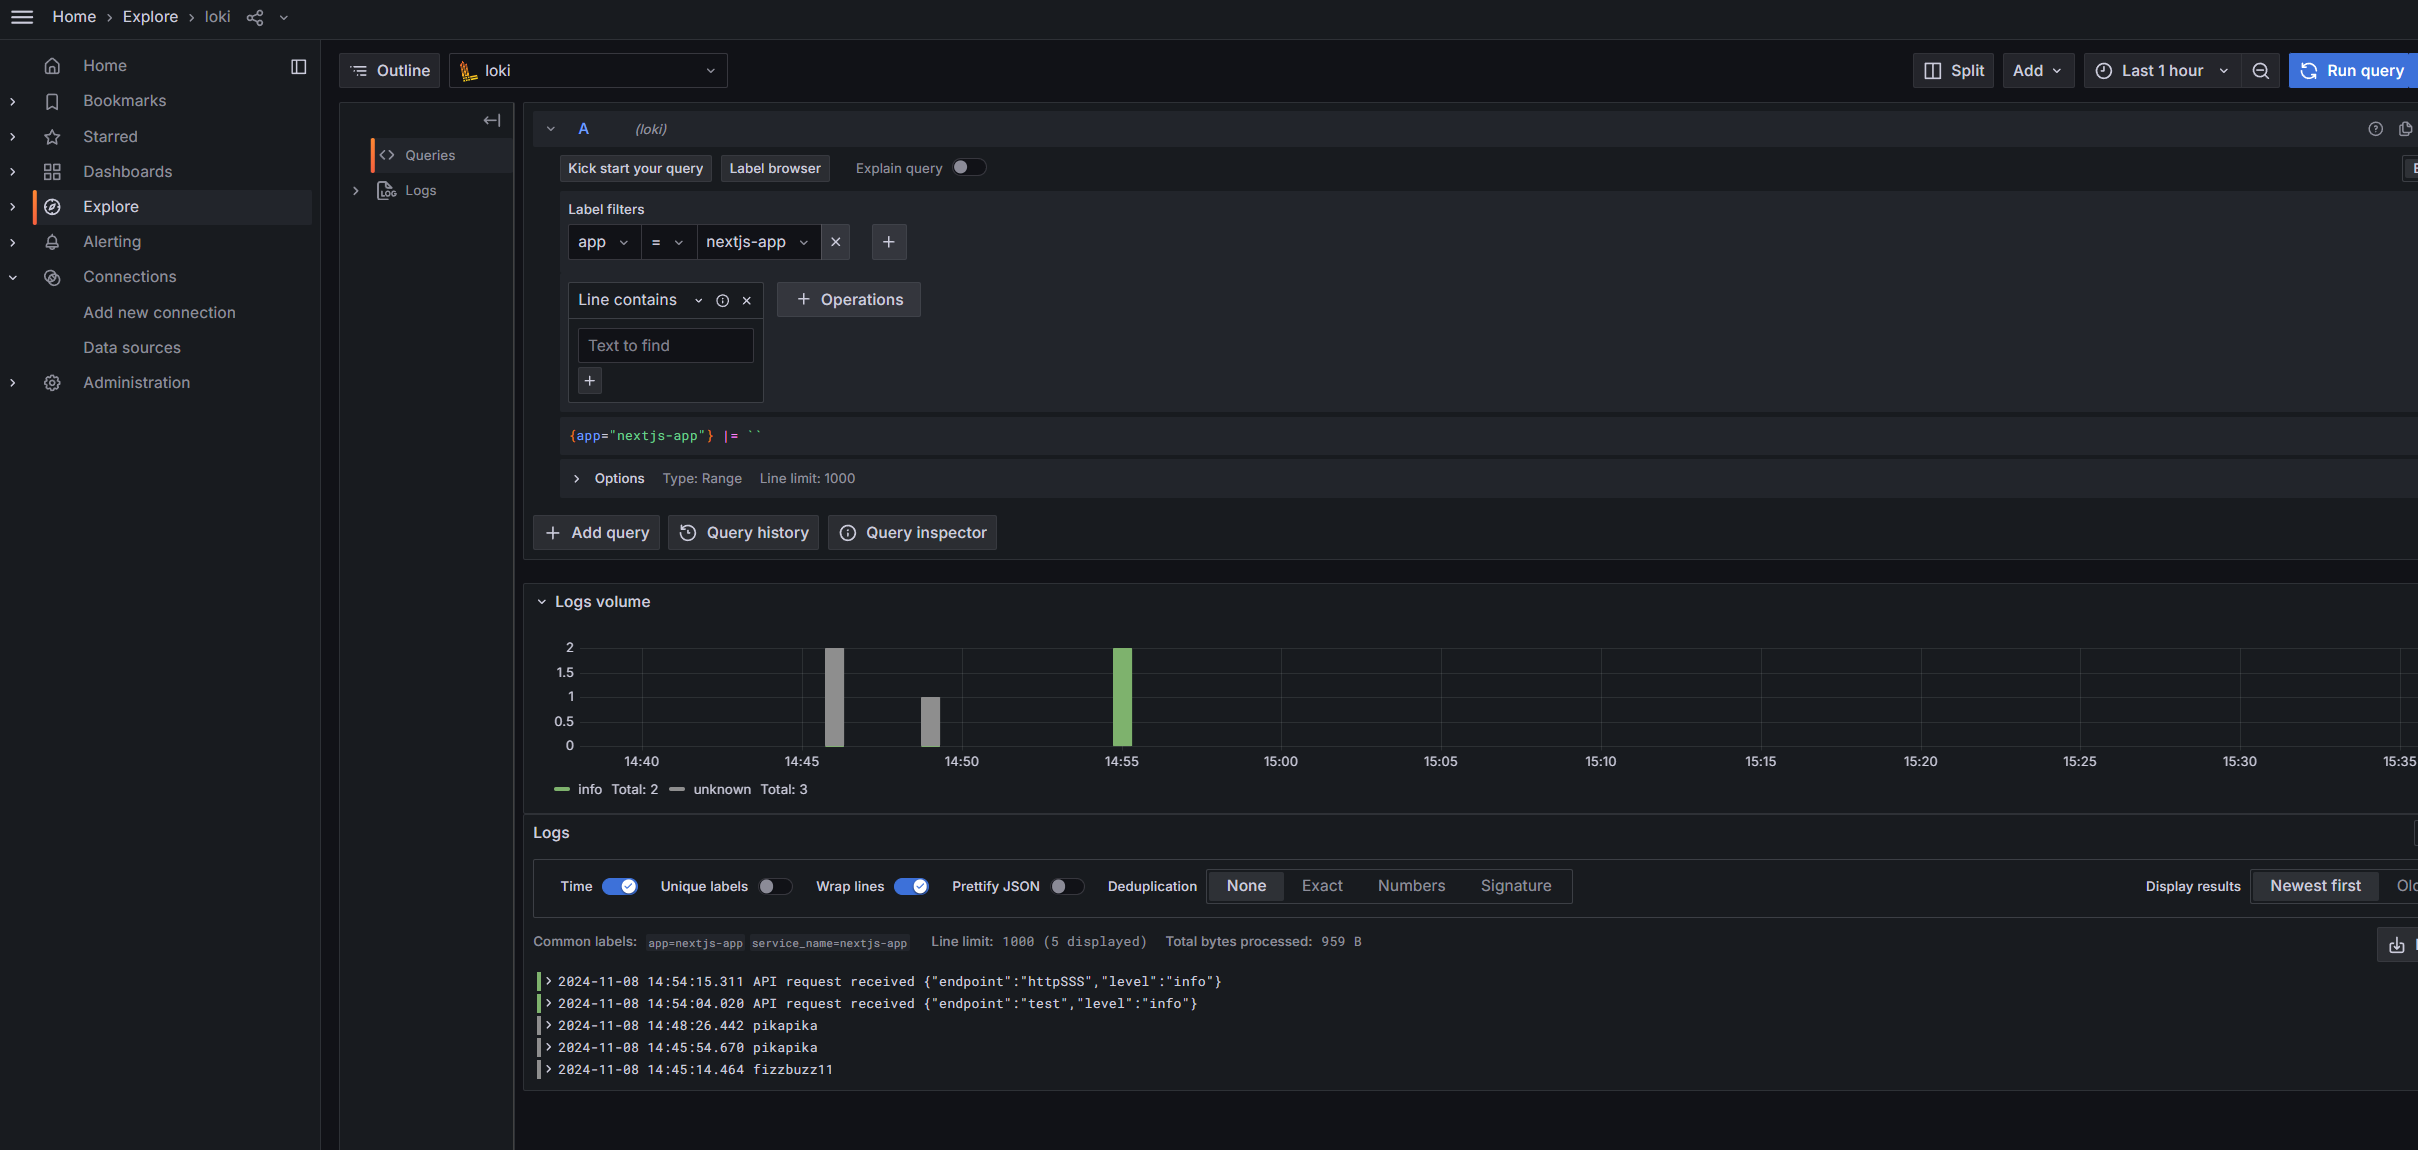
Now you can use the Explore feature in the dashboard to query the log entry we just wrote. You must include at least one filter condition, or the query will return no results.
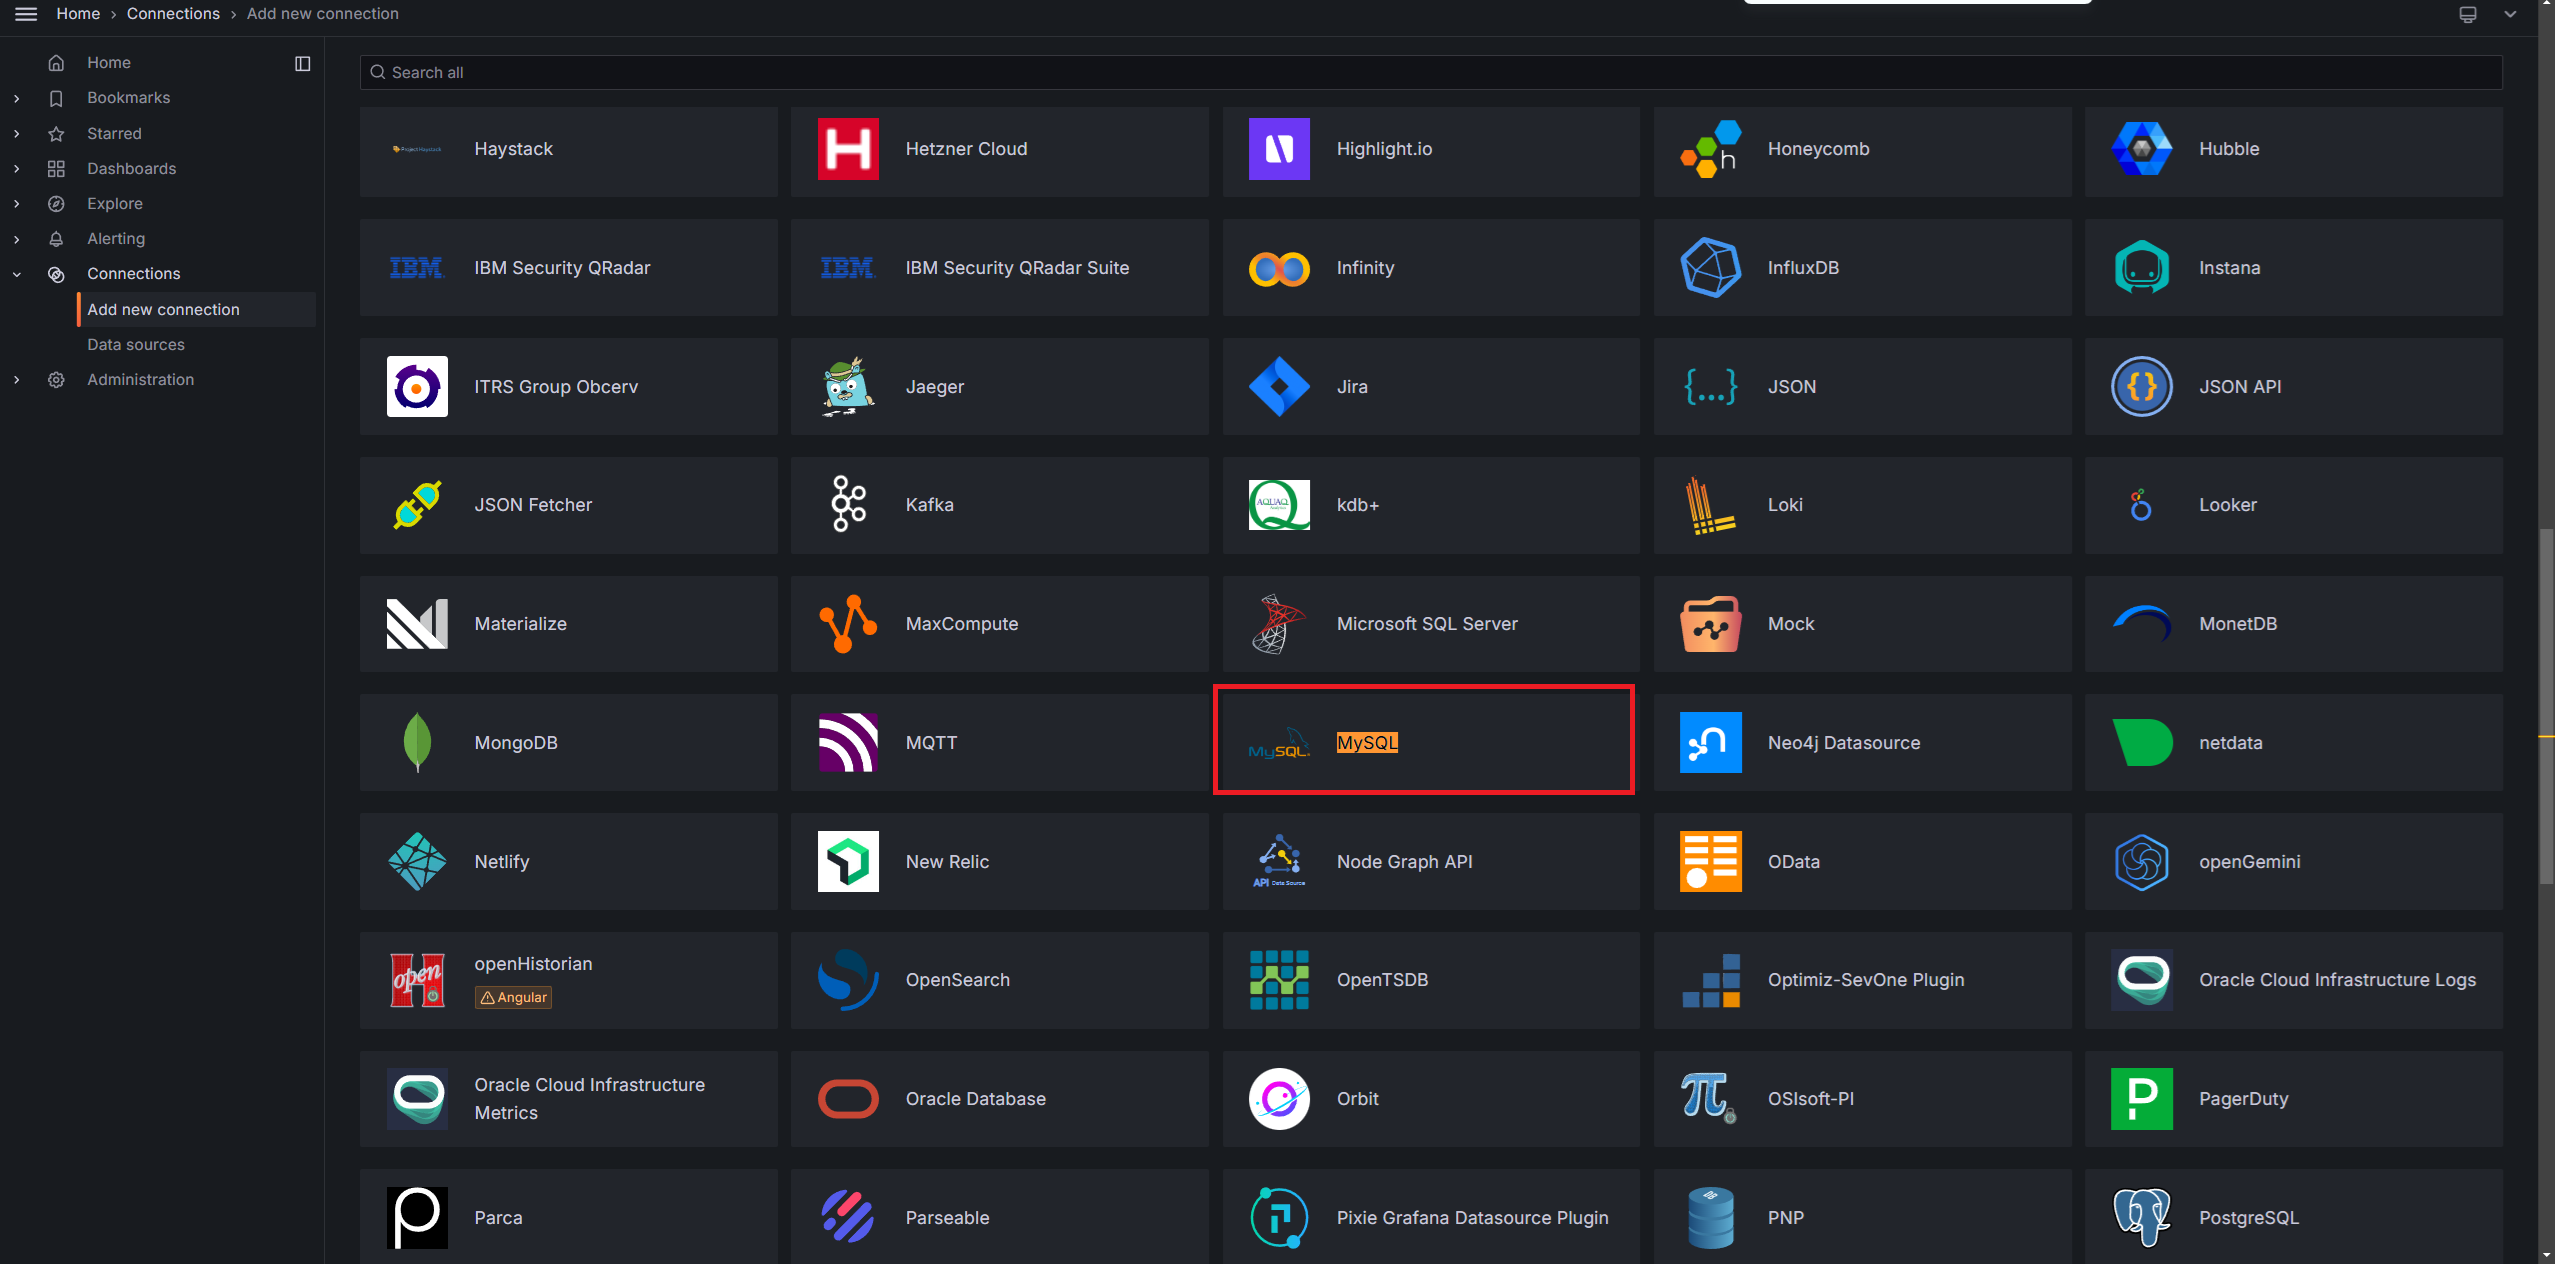
Note: Grafana actually supports many databases and services as data sources, such as MySQL and Jira. You can easily read data from them to create charts.
Application Integration
Integrating Loki in Next.js
Next, install the required packages in your Next.js backend:
npm install winston winston-loki --save
Create a logger.ts file
import winston from 'winston';
import LokiTransport from 'winston-loki';

const logger = winston.createLogger({
  transports: [
    new LokiTransport({
      host: 'http://localhost:3100',
      labels: { app: 'nextjs-app' },
      json: true,
    }),
  ],
});

export default logger;
To use it in a page:
import logger from '@/lib/log/loki-log';
logger.info('API request received', { endpoint: 'https://www.abc.com' });
Frontend Application: Writing Logs via fetch
const LogLevel = {
  Information: "info",
  Debug: "debug",
  Warning: "warn",
  Error: "error",
};

async function clientLog(message, level = LogLevel.Information, extraLabels = {}) {
  if (!message) return;

  const timestamp = `${Date.now()}000000`; // 將毫秒級時間轉為納秒級
  const logData = {
    streams: [
      {
        stream: {
          app: "frontend-app",
          level: level,
          ...extraLabels, // 額外的標籤,例如用於區分不同頁面或功能
        },
        values: [
          [timestamp, message]
        ]
      }
    ]
  };

  try {
    const response = await fetch(LOKI_URL, {
      method: "POST",
      headers: {
        "Content-Type": "application/json",
        // "Authorization": "Bearer YOUR_TOKEN" // 如果 Loki 設置了 Token 驗證,啟用此行
      },
      body: JSON.stringify(logData),
    });

    if (!response.ok) {
      console.error("Failed to send log to Loki:", response.statusText);
    }
  } catch (error) {
    console.error("Error sending log to Loki:", error);
  }
}
// 發送信息級別的日誌
clientLog("This is an informational message", LogLevel.Information, { page: "home" });

// 發送錯誤級別的日誌
clientLog("An error occurred", LogLevel.Error, { page: "checkout", userId: 12345 });
Note: If you need to add a token to Loki, the simplest way is to add token validation when forwarding requests through Nginx.
server {
    listen 80;
    location /loki/ {
        proxy_pass http://localhost:3100; # Loki Url
        proxy_set_header Authorization "Bearer YOUR_TOKEN"; # 令牌
        # 可根据需求限制访问的 IP、路径等
        if ($http_authorization != "Bearer YOUR_TOKEN") {
            return 403; # 拒绝访问
        }
    }
}


Comments