
Preface
Uptime Kuma is an open-source monitoring tool — already great out of the box. But if you need to monitor more than 1,000 APIs on a single instance, things start getting sluggish. In this article I'll use Vibe Coding to walk through upgrading Uptime Kuma into a version that supports sharding and clustering, plus add APIs for easier automation.
Why bother with a Cluster?
First, the requirements.
Uptime Kuma is open-source monitoring software. I previously shared how to switch its backend to MariaDB. We replaced the default SQLite with MariaDB, deployed independently as kuma-mariadb, to support higher concurrent reads/writes.
However, once monitoring scales past 1,000 APIs, performance noticeably drops — real testing confirmed sluggishness as the count grows. Uptime Kuma is a Node.js app, and Node.js's single-threaded architecture inherently has a performance ceiling under heavy concurrency. That led me to also research practical solutions for Node.js single-thread performance limits.
Plus, our department's systems need to monitor nearly 4,000 APIs — a single Uptime Kuma instance just won't cut it.
For services with SLA-based billing, monitoring downtime can mean direct contractual penalties — the monitoring platform itself must be highly available.
Also, open-source Uptime Kuma doesn't support a RESTful API, which is very inconvenient for "API automatically goes live and becomes monitored" workflows. To avoid extra container deployment cost, we extended a RESTful API directly into Uptime Kuma.
Based on these needs and limitations, Cluster architecture is the natural answer, ensuring:
- Fault tolerance / failover: nodes can fail without service interruption
- Load distribution: multiple instances share the load — more stable performance
- High availability: avoid single points of failure, transparent and reliable data
- Automation: API-driven monitoring creation — easier for DevOps
Break down requirements, organize ideas, plan and implement with Vibe Coding
In the spirit of Vibe Coding: break the requirements into small pieces, then build piece by piece. For larger and more complex projects, ask AI to draft a plan or guideline first, iteratively refine the AI-written plan, and finally have AI execute it.
1. Sharding support
Different monitors need to be distributed to different nodes:
- Add / modify / delete nodes
- Clearly indicate which node each monitor runs on
- On container start, auto-register the node into the database
2. Health Check
Use Nginx / OpenResty + Lua (health_check.lua) for node health checks:
Nginx Job mechanism
OpenResty provides a powerful scheduled-task mechanism — easily implement periodic health checks via ngx.timer.at():
init_worker_by_lua_block: runs when each worker process starts; initializes the health-check timerngx.timer.at(delay, callback): creates a one-shot timer that runs the callback after the specified delay- Recursive timers: in the
health_check_workercallback, after running the health check, callngx.timer.at()again — forming a periodic loop - Avoid duplicate execution: use
ngx.shared.DICTor marker variables to ensure each worker only starts one health-check task
This design keeps health checks running entirely inside Nginx workers — no extra external process or cron job needed. Efficient and reliable.
Health-check flow
- OpenResty's worker periodically calls
health_check_worker, runningrun_health_checkat fixed intervals - For each node, call
/api/v1/healthfor an HTTP health check - On consecutive failures → mark the node's status in the DB
nodetable asoffline - On consecutive successes → update
node.statusback toonlineand trigger the "monitor restoration" flow
3. Failover
When a node dies, monitoring tasks must auto-migrate. This is handled by health_check.lua plus the database:
- Add a dedicated
nodetable and node-related fields in the DB to record each node'sstatus,last_seen - The
monitortable records each monitor's currentnode_id(andassigned_nodewhen needed) - When a node fails health check several times consecutively:
- health_check marks the node as
offline - Calls
redistribute_monitors_from_node(node_id)to evenly distribute the monitors that node was responsible for to otheronlinenodes
- health_check marks the node as
- When the node recovers (consecutive successful checks):
- health_check marks the node as
online - Calls
revert_monitors_to_node(node_id)to move auto-migrated monitors back to the original node, preventing long-term imbalance
- health_check marks the node as
4. Node Recovery
Recovered nodes need to come back automatically:
- Auto-register on restart, status set to
online - The system moves migrated monitors back
- Ensure no duplicate execution, prevent data conflicts
- Also provide manual recovery — let admins decide whether to migrate back
5. RESTful API extension
Automation extension (RESTful API Extension): since native Uptime Kuma lacks an external API, to achieve "service goes live → automatically monitored" automation, we extended a RESTful API that automatically sets up monitoring when APIs are onboarded.
Uptime Kuma actually has plenty of built-in logic — it just doesn't expose APIs (everything goes through WebSocket). Knowing that, we can ask AI to expose the Service as APIs, making automation much easier.
6. OpenResty unified entry and load balancing
To present a single external entry point while internally distributing traffic among multiple Kuma nodes, we use OpenResty as the unified proxy and routing layer. This entry dynamically selects target nodes based on health and load, while handling real-time communication, APIs, and static content proxying. When a node fails, it auto-bypasses; when recovered, it re-flows — ensuring scalability and fault tolerance.
7. Manual node switching
On top of automatic load balancing and Failover, provide a "manual node switching" capability: admins can switch single or multiple monitoring tasks to a specific node, drain a node before maintenance, or temporarily lock/pin total traffic to a specific node (including pinning via Cookie). These manual operations cooperate with existing health-check and auto-migration mechanisms — they don't conflict.
System architecture
System Architecture

                              ┌────────────────────────────┐
                              │   OpenResty (Nginx + Lua)  │
                              │  ─ Load balancer (monitor_router) │
                              │  ─ Health check (health_check)    │
                              └─────────┬──────────────────┘
                                        │
                     ┌──────────────────┼────────────────────┐
                     │                  │                    │
          ┌───────────▼─────────┐ ┌─────▼────────────┐ ┌─────▼────────────┐
          │   Uptime Kuma       │ │   Uptime Kuma    │ │   Uptime Kuma    │
          │   Node 1            │ │   Node 2         │ │   Node 3         │
          │   (Port 3001)       │ │   (Port 3001)    │ │   (Port 3001)    │
          │   (Host: 9091)      │ │   (Host: 9092)   │ │   (Host: 9093)   │
          └─────────┬───────────┘ └─────┬────────────┘ └──────┬───────────┘
                    │                   │                     │
                    └───────────────────┼─────────────────────┘
                                        │
                              ┌─────────▼─────────┐
                              │     MariaDB       │
                              │   (Port 3306)     │
                              │   (Host: 9090)    │
                              └───────────────────┘
Key components:
- OpenResty / Nginx: only defines a virtual
upstream uptime_kuma_clusterinnginx.conf; the actual node selection is delegated to Lua. monitor_router.lua: invoked inbalancer_by_lua_block, providingpick_node_for_request()— dynamically picks the least-busy node based on each node's current "running monitor count," and routes viangx.balancer.set_current_peer()to the correspondinguptime-kuma-nodeXcontainer.health_check.lua: periodically scans node health, updates the DBnodetable, and triggers automatic monitoring task migration and restoration on node failure/recovery.
Flow diagrams
1. Load balancing and routing flow (monitor_router.lua)
Request flow

Client Request
      │
      ▼
Nginx / OpenResty
  (location /, /api/, /socket.io/ → proxy_pass to uptime_kuma_cluster)
      │
      ▼
balancer_by_lua_block
  calls monitor_router.pick_node_for_request()
      │
      ▼
Query DB:
  SELECT n.node_id, COUNT(m.id) AS monitor_count
  FROM node n
  LEFT JOIN monitor m ON m.node_id = n.node_id AND m.active = 1
  WHERE n.status = 'online'
  GROUP BY n.node_id
  ORDER BY monitor_count ASC, node_id ASC
      │
      ▼
Pick the online node with the fewest monitors (e.g., node2)
      │
      ▼
Compose upstream: uptime-kuma-node2:3001
      │
      ▼
ngx.balancer.set_current_peer("uptime-kuma-node2", 3001)
      │
      ▼
Request actually forwarded to the corresponding Uptime Kuma node
2. Health check and Failover / Recovery flow (health_check.lua)
Health check and auto-migration flow

Health check worker periodically runs run_health_check()
      │
      ▼
Query DB to get all nodes (node table)
      │
      ▼
For each node, call /api/v1/health
      │
      ├── Healthy: update node.status = 'online', reset failure count;
      │           on consecutive successes trigger revert_monitors_to_node(node_id)
      │
      └── Failed: accumulate failure count; once threshold is reached,
                 set node.status = 'offline' and trigger
                 redistribute_monitors_from_node(node_id),
                 evenly distributing monitors to other online nodes
      │
      ▼
Health status and stats written to DB + ngx.shared.health_checker
      │
      ▼
Expose overall status externally via /health, /api/health-status, /lb/health, /lb/capacity APIs
Results
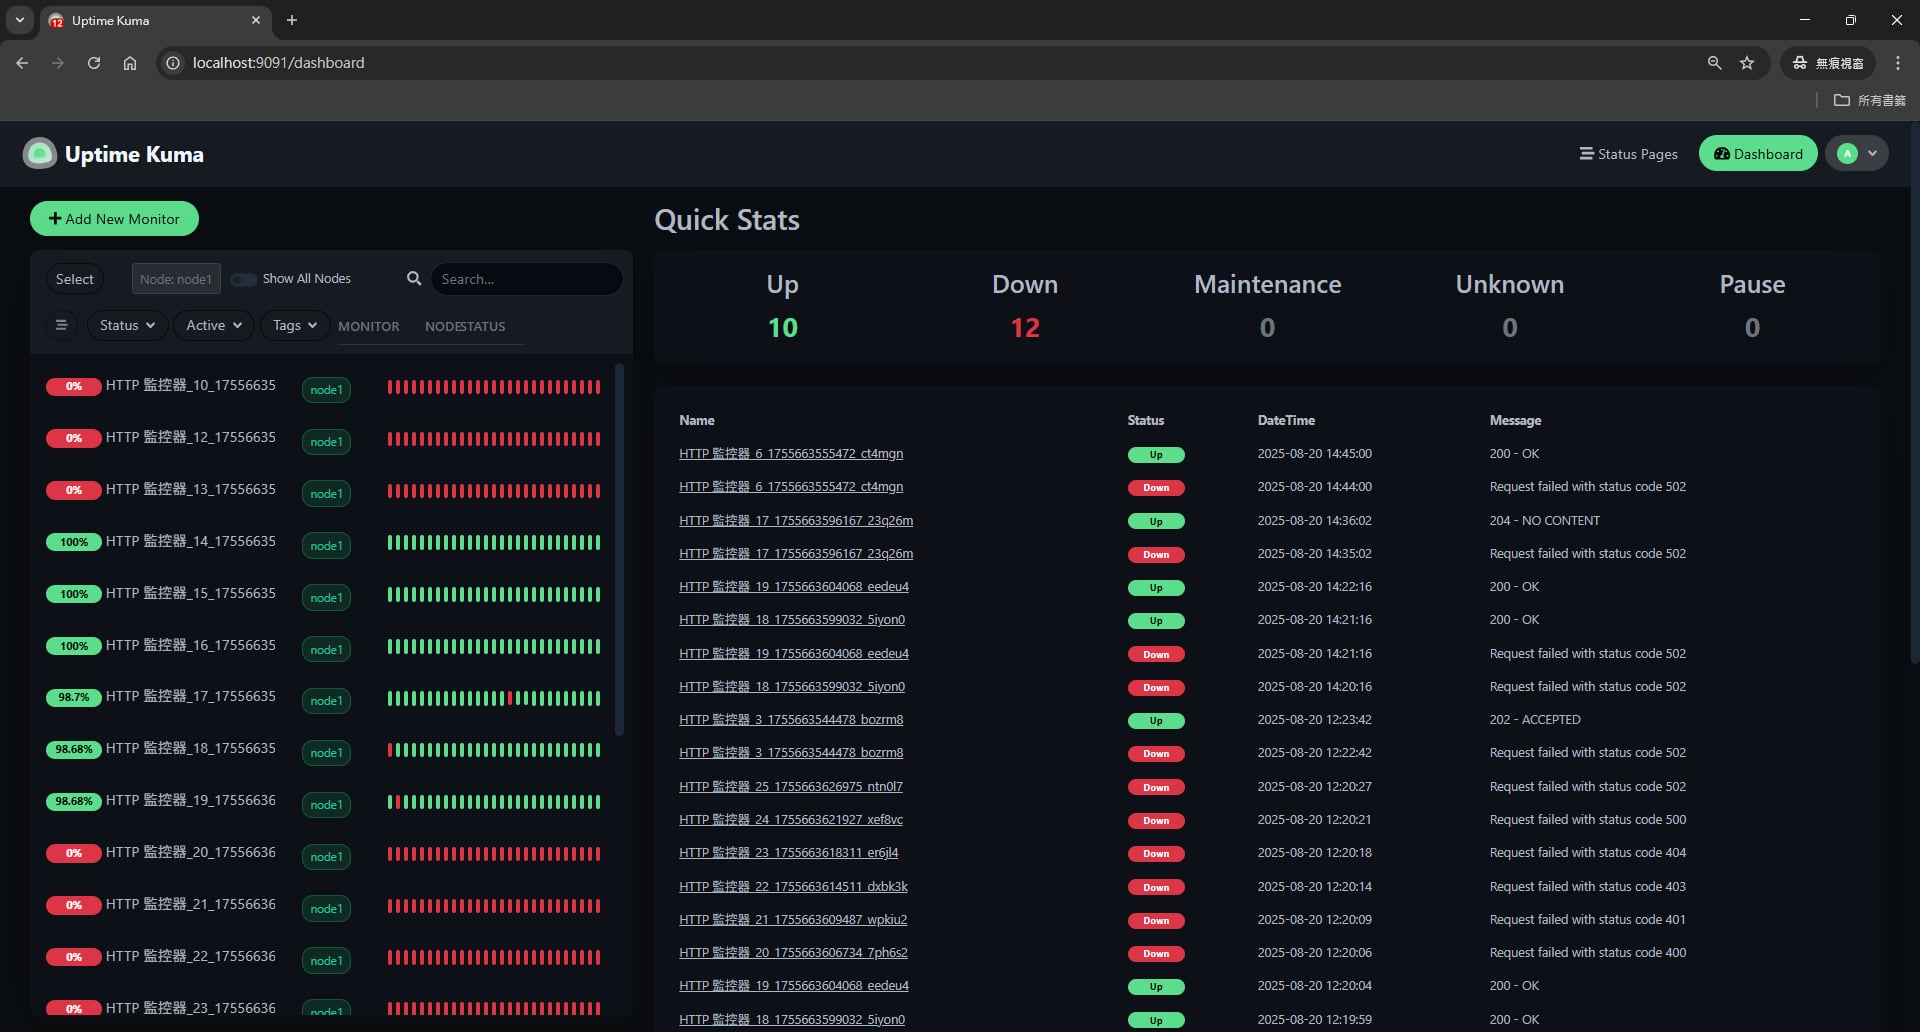
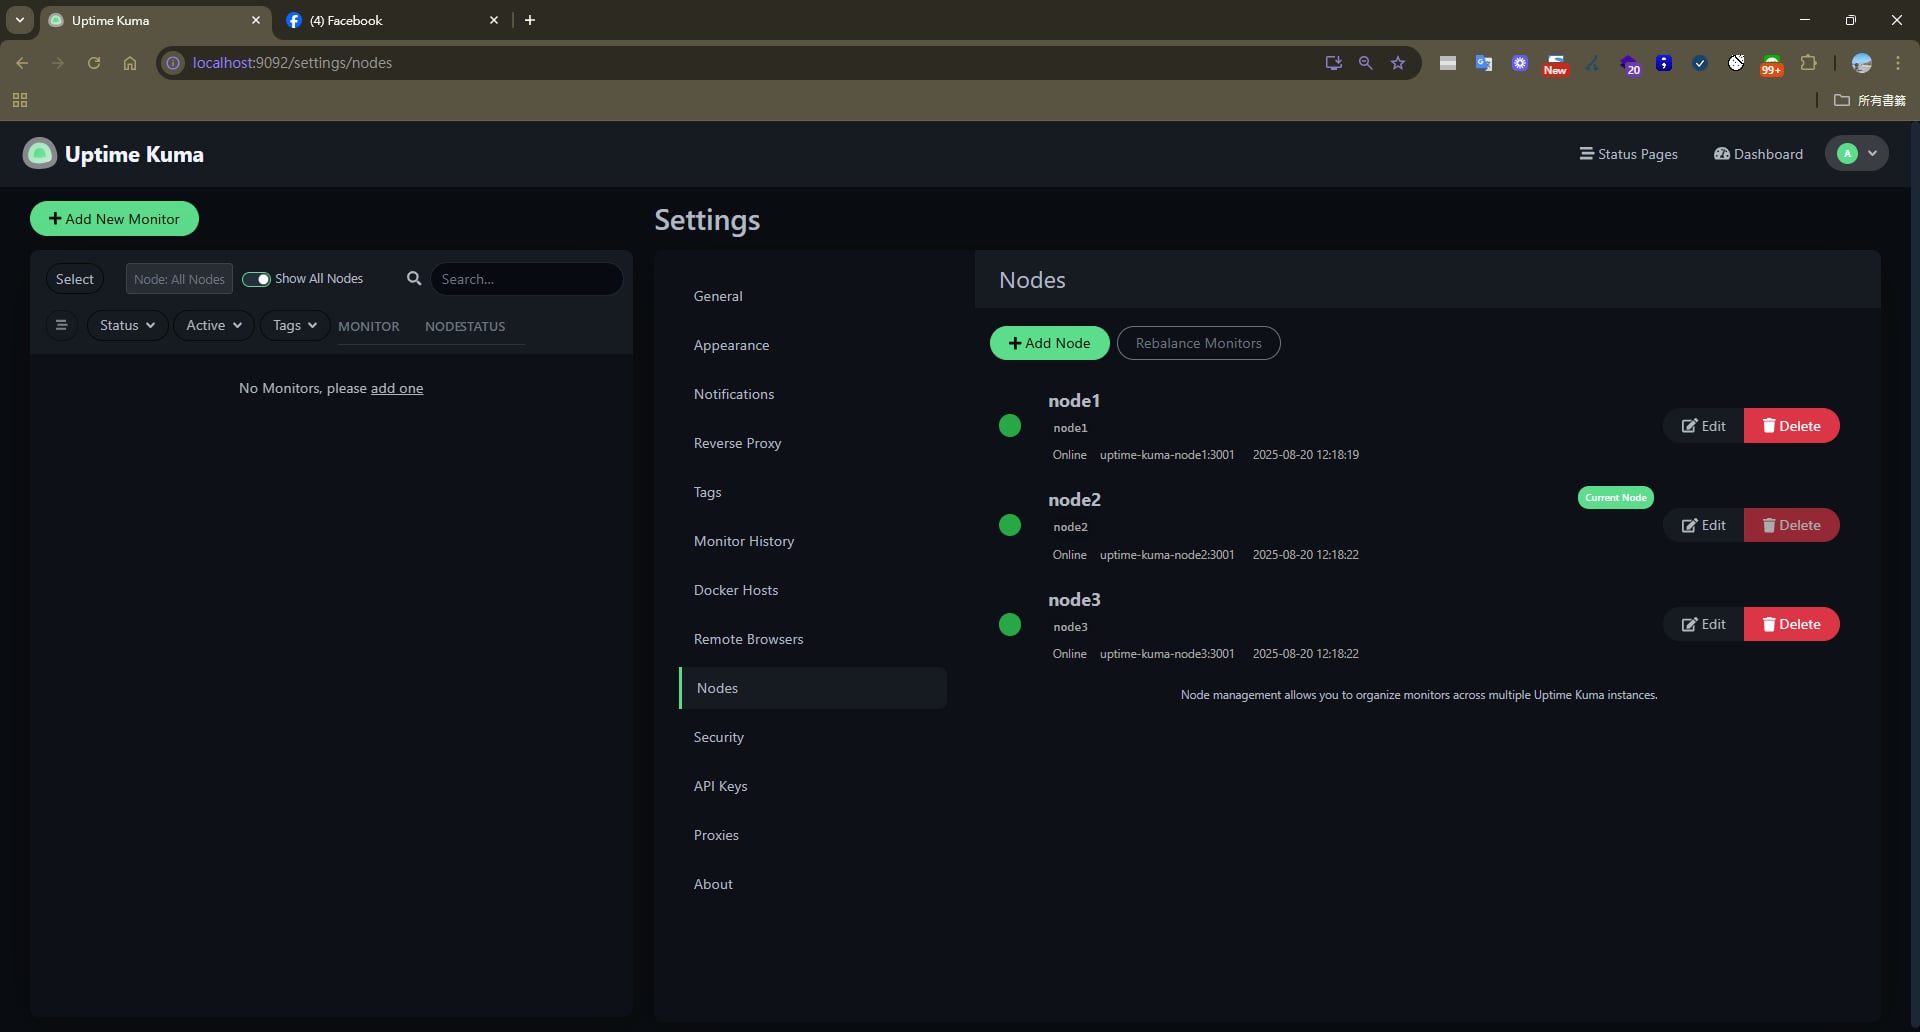
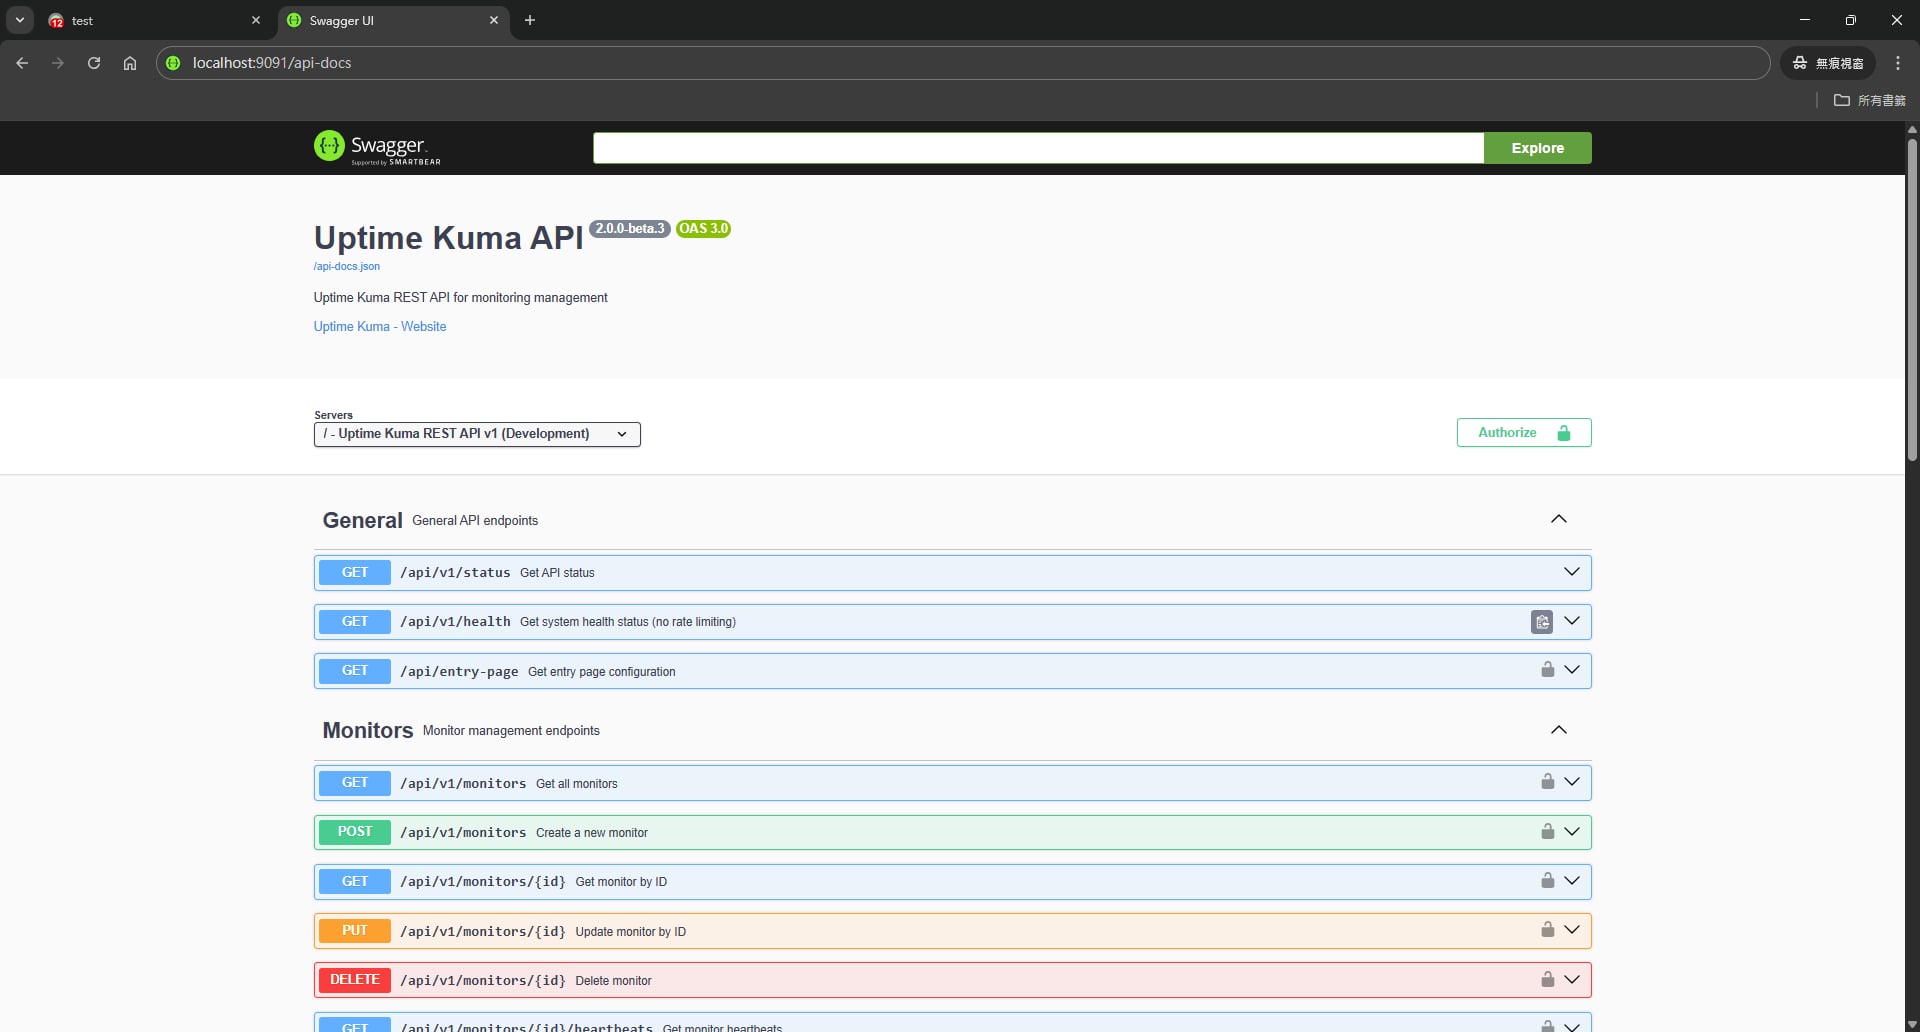
After discussing with my supervisor, since we take from the community we give back to the community — the related code is open-sourced:
Uptime Kuma Cluster GitHub repo
Reflections
The AI era may have multiplied productivity by 5–10×, freeing us from typing every line by hand. But during later maintenance, we discover insufficient familiarity with the code. This drives home a deep lesson: no matter how tools evolve, someone ultimately needs to truly understand and maintain the code. Technical depth and comprehension remain irreplaceable.


Comments