
Introduction
Prometheus and Grafana are a common combination in the Kubernetes ecosystem. This post demonstrates how to use Prometheus to monitor Nginx requests and visualize the data with Grafana.
Understanding Nginx stub_status
Before spinning up the Prometheus container, let's take a look at Nginx's stub_status module. It exposes basic runtime metrics about Nginx, and Prometheus primarily relies on stub_status to collect data from Nginx.
Configuring the Dockerfile
First, create a Dockerfile that builds on the Nginx image with custom configuration:
FROM nginx
COPY nginx.conf /etc/nginx/conf.d/default.conf
Creating nginx.conf
Next, write an nginx.conf to enable the Nginx status page, which Prometheus will scrape:
server {
    listen 80;  # 使用本地端口
    server_name localhost;  # 設定為 localhost

    location /nginx_status {
        stub_status on;  # 啟用狀態模組
        access_log off;
        allow all;  # 允許所有 IP 訪問
    }
}
Build and Start the Container
Build the Docker image and start the container:
docker build -t my-nginx:latest .
docker run -d -p 8881:80 --name nginx-prometheus-exporter my-nginx:latest
Accessing the Nginx Status Page
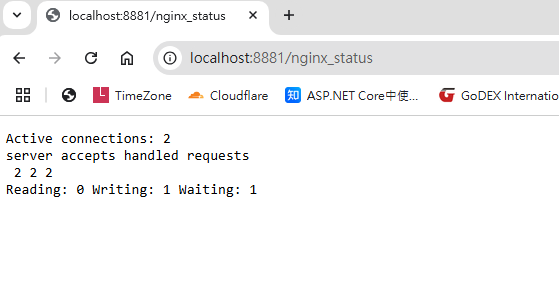
Once the container is running, visit http://localhost:8881/nginx_status and you'll see a page similar to this:
Nginx Status Fields Explained
Active connections: 2 There are currently 2 active connections.
server accepts handled requests: 2 2 2
- 2: Number of accepted connections.
- 2: Number of successfully handled connections.
- 2: Total number of requests (can exceed connection count, since one connection can serve multiple requests).
Reading: 0 Writing: 1 Waiting: 1
- Reading: 0: Connections currently reading a request.
- Writing: 1: Connections currently sending a response.
- Waiting: 1: Idle connections waiting for the next request (HTTP Keep-Alive).
Note: The server load is currently light — 2 connections total, 1 actively handling a request and 1 waiting for the next one.
Container Stack Overview
grafana (dashboard visualization) > prometheus-exporter (actively scrapes data) > nginx-prometheus-exporter (exposes Nginx metrics to Prometheus) > nginx status (web server providing status information)
Setting Up All Service Containers
Remove any previously created test containers, then create a deployment.yaml to deploy all services together.
deployment.yaml Example
version: "3.8"
services:
  mynginx:
    build: ./nginx/
    container_name: mynginx
    ports:
      - 8885:80

  nginx-prometheus-exporter:
    image: nginx/nginx-prometheus-exporter
    container_name: nginx-prometheus-exporter
    command: -nginx.scrape-uri http://nginx:80/nginx_status
    ports:
      - 9113:9113
    depends_on:
      - nginx

  prometheus:
    image: prom/prometheus:v2.35.0
    container_name: prometheus
    volumes:
      - ./prometheus.yaml:/etc/prometheus/prometheus.yaml
      - ./prometheus_data:/prometheus
    command:
      - "--config.file=/etc/prometheus/prometheus.yaml"
    ports:
      - "9090:9090"

  renderer:
    image: grafana/grafana-image-renderer
    environment:
      BROWSER_TZ: Asia/Taipei
    ports:
      - "8082:8081"

  grafana:
    image: grafana/grafana
    container_name: grafana
    volumes:
      - ./grafana_data:/var/lib/grafana
    environment:
      GF_SECURITY_ADMIN_PASSWORD: pass
      GF_RENDERING_SERVER_URL: http://renderer:8082/render
      GF_RENDERING_CALLBACK_URL: http://grafana:3007/
      GF_LOG_FILTERS: rendering:debug
    depends_on:
      - prometheus
      - renderer
    ports:
      - "3007:3000"
Prometheus Configuration
Write a prometheus.yaml to configure how Prometheus scrapes data:
global:
  scrape_interval: 5s  # 設定抓取頻率
  external_labels:
    monitor: "my-monitor"

scrape_configs:
  - job_name: "prometheus"
    static_configs:
      - targets: ["localhost:9090"]
  - job_name: "nginx_exporter"
    static_configs:
      - targets: ["nginx-prometheus-exporter:9113"]
Start the services with Docker Compose:
docker-compose -f ./deployment.yaml up -d
Checking Prometheus Targets
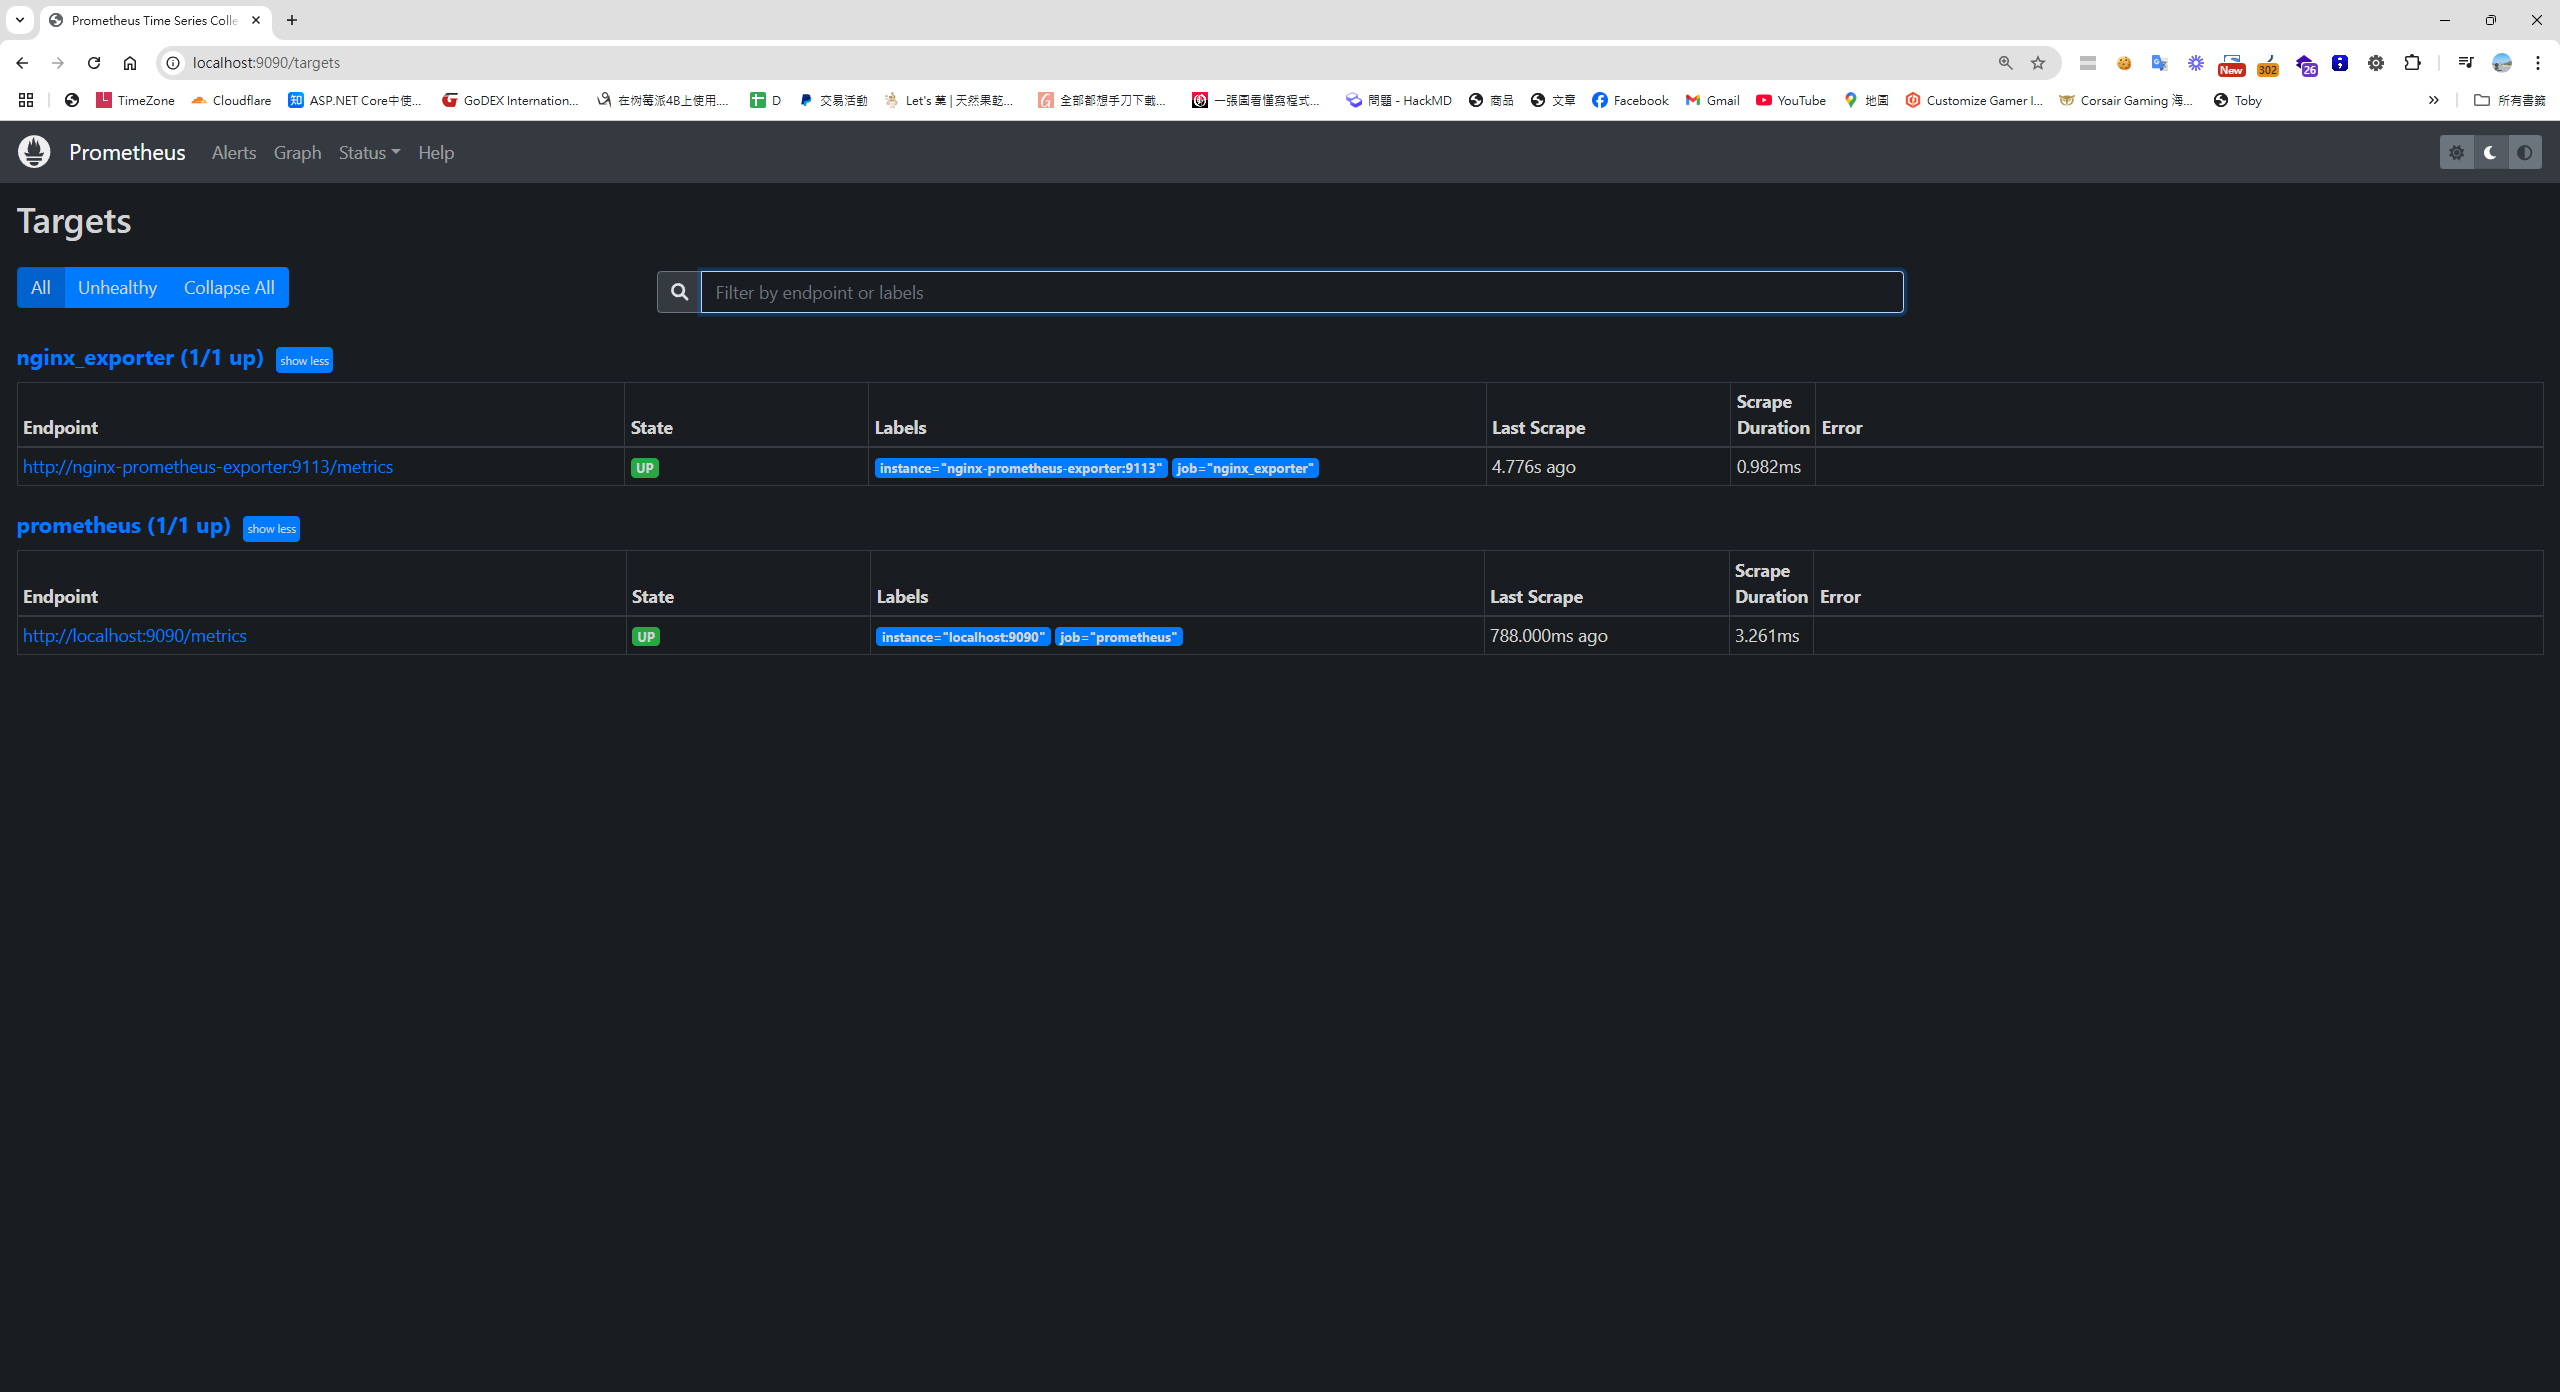
Open http://localhost:9090/targets in your browser to view the status of Prometheus scrape targets.
Graphing Nginx Metrics in Prometheus
Switch to the Graph tab in Prometheus and search for nginx to plot real-time charts based on Nginx metrics:
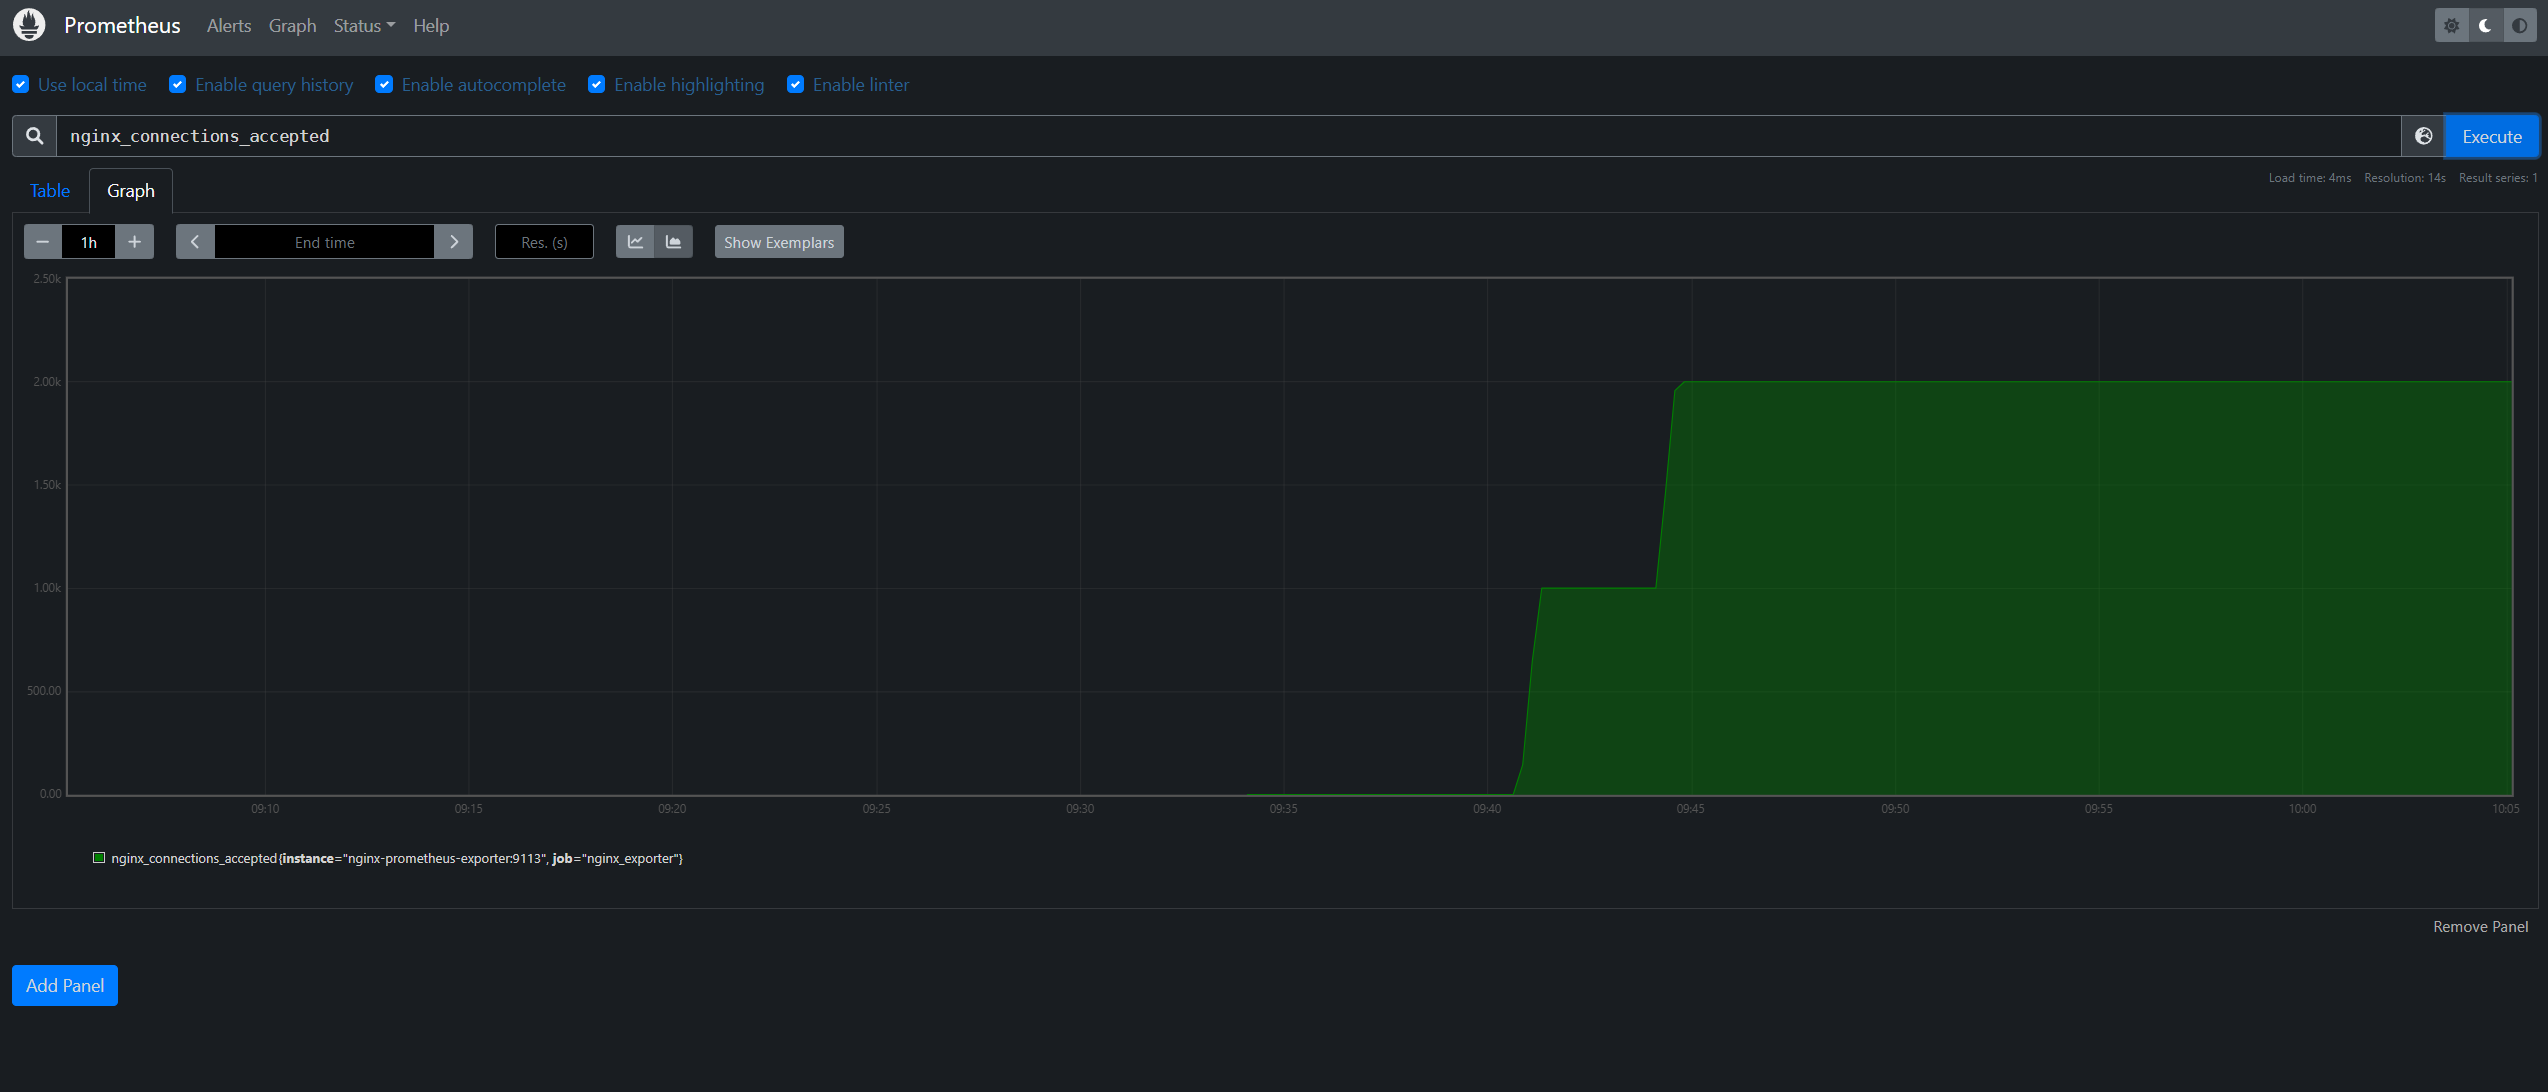
That said, Prometheus charts are fairly basic. For richer dashboards and more filtering options, Grafana is the way to go.
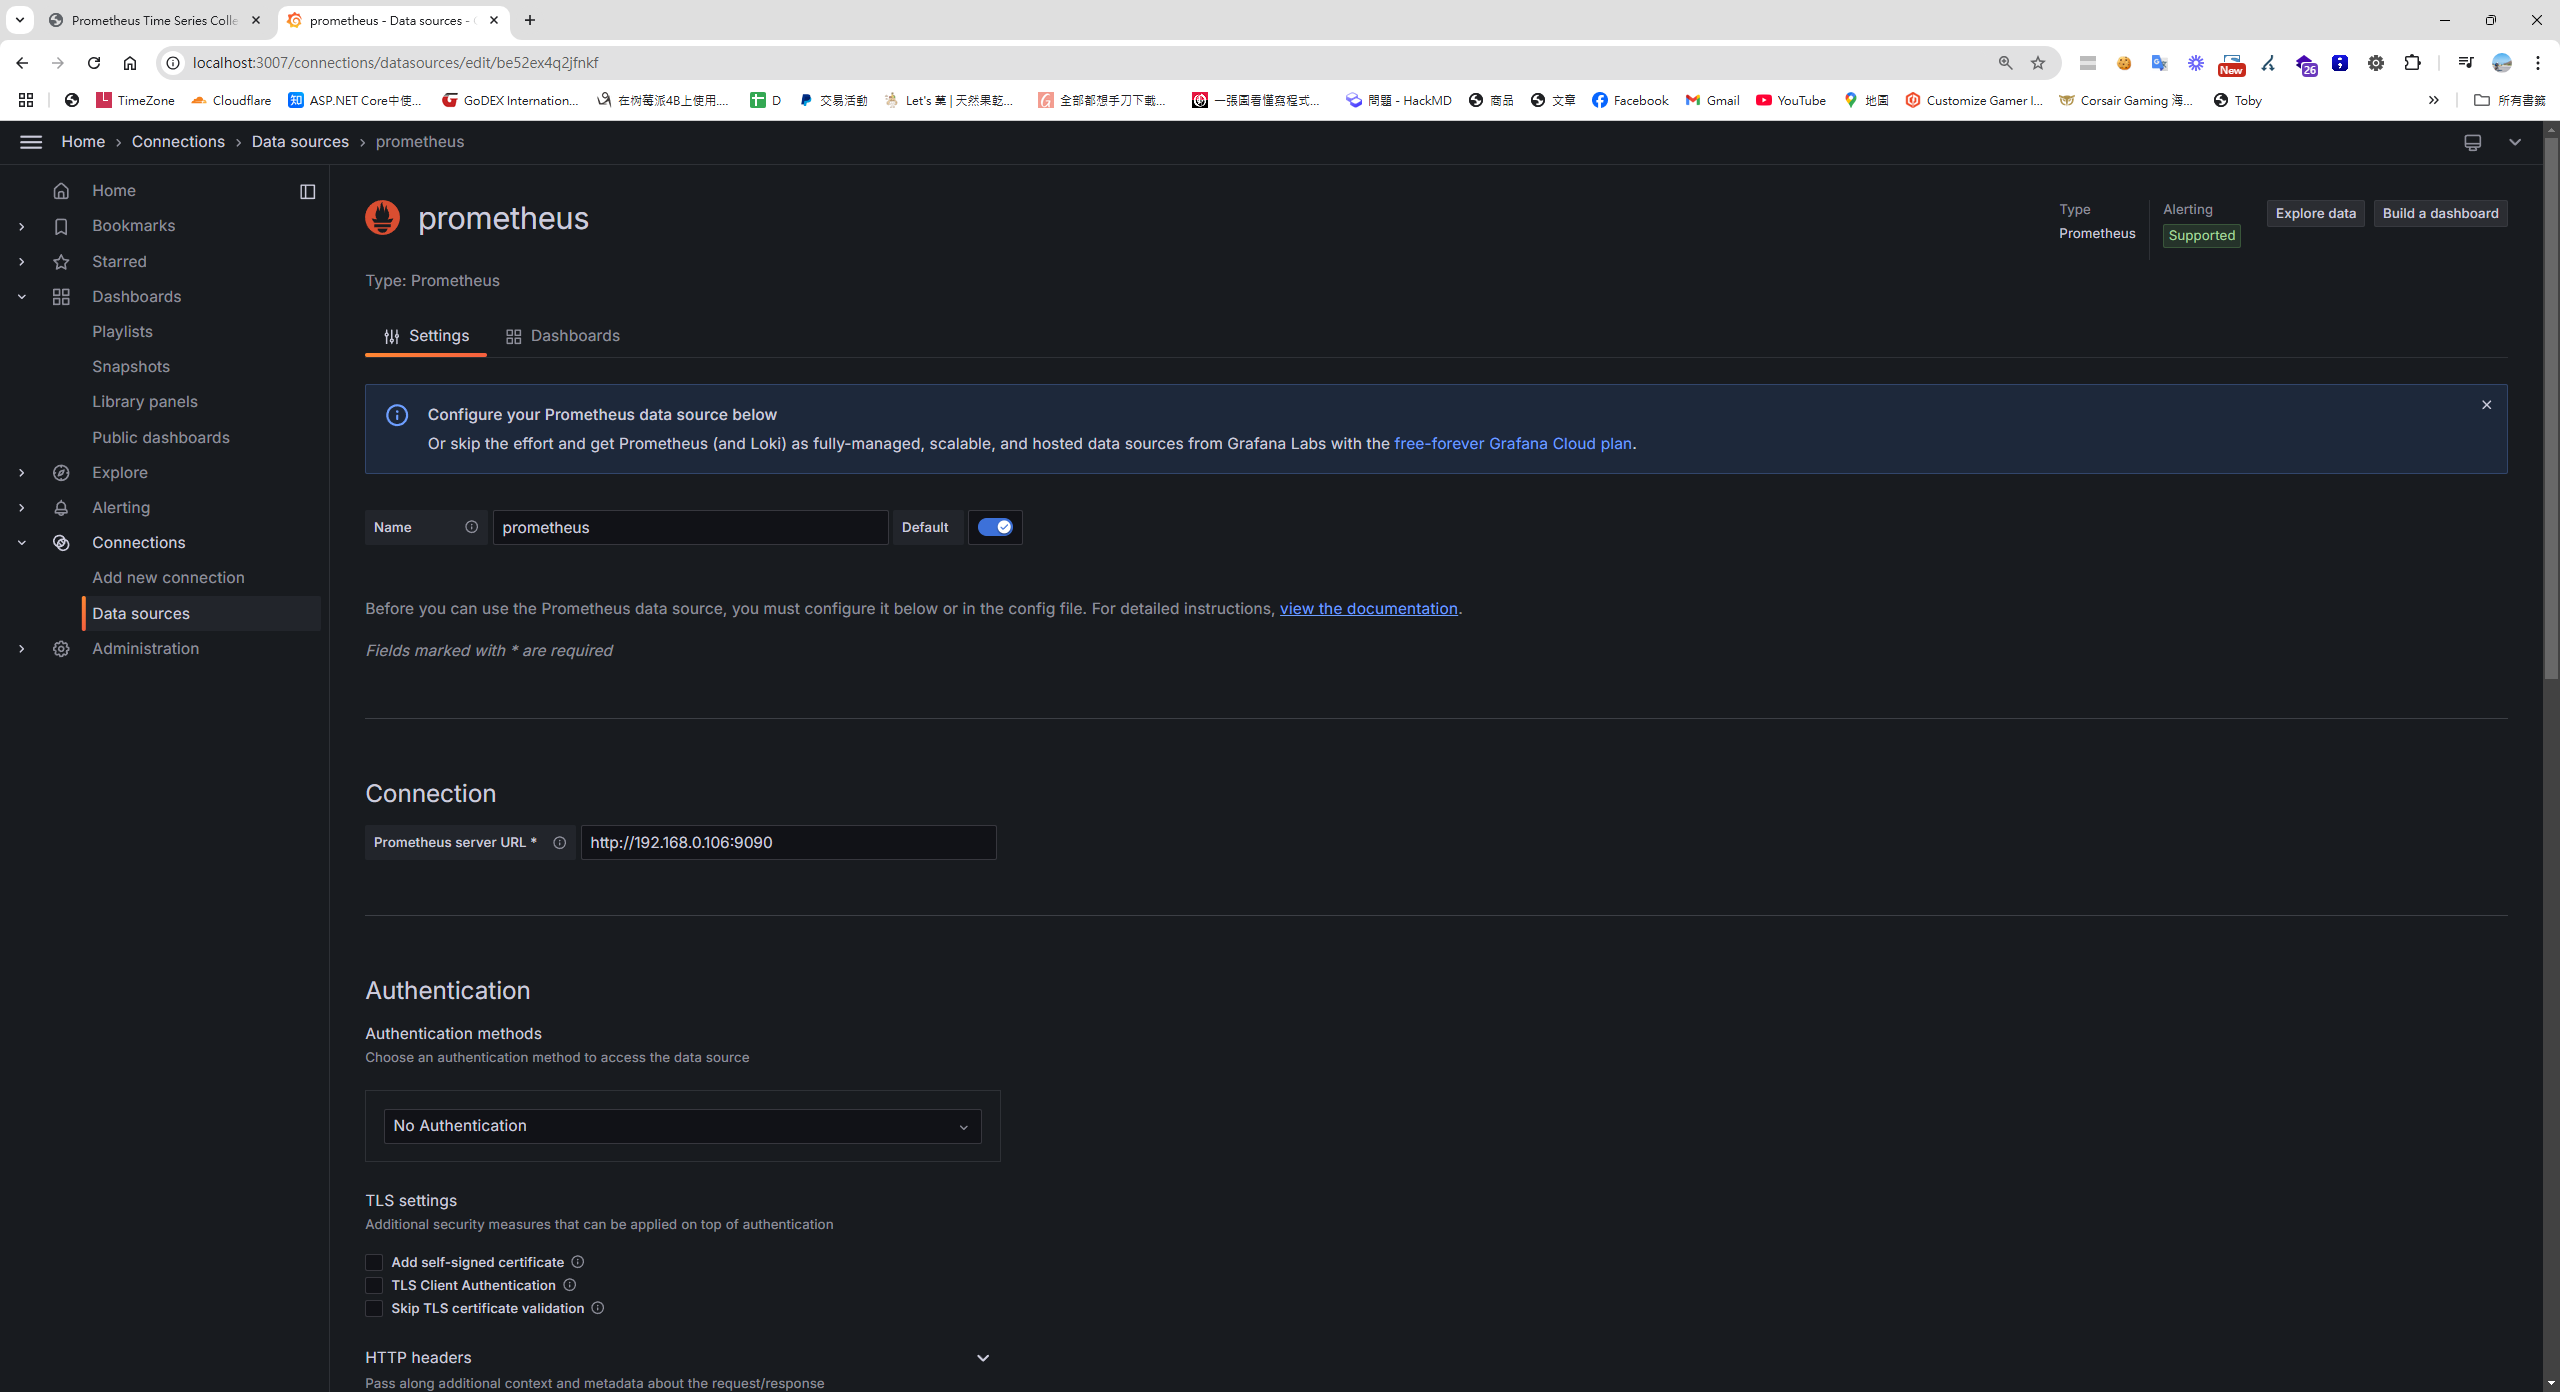
Connecting Grafana to Prometheus
- Open the Grafana dashboard (http://localhost:3007/).
- Go to "Connection", click "Add new connection", and select "Prometheus".
Creating a Grafana Dashboard
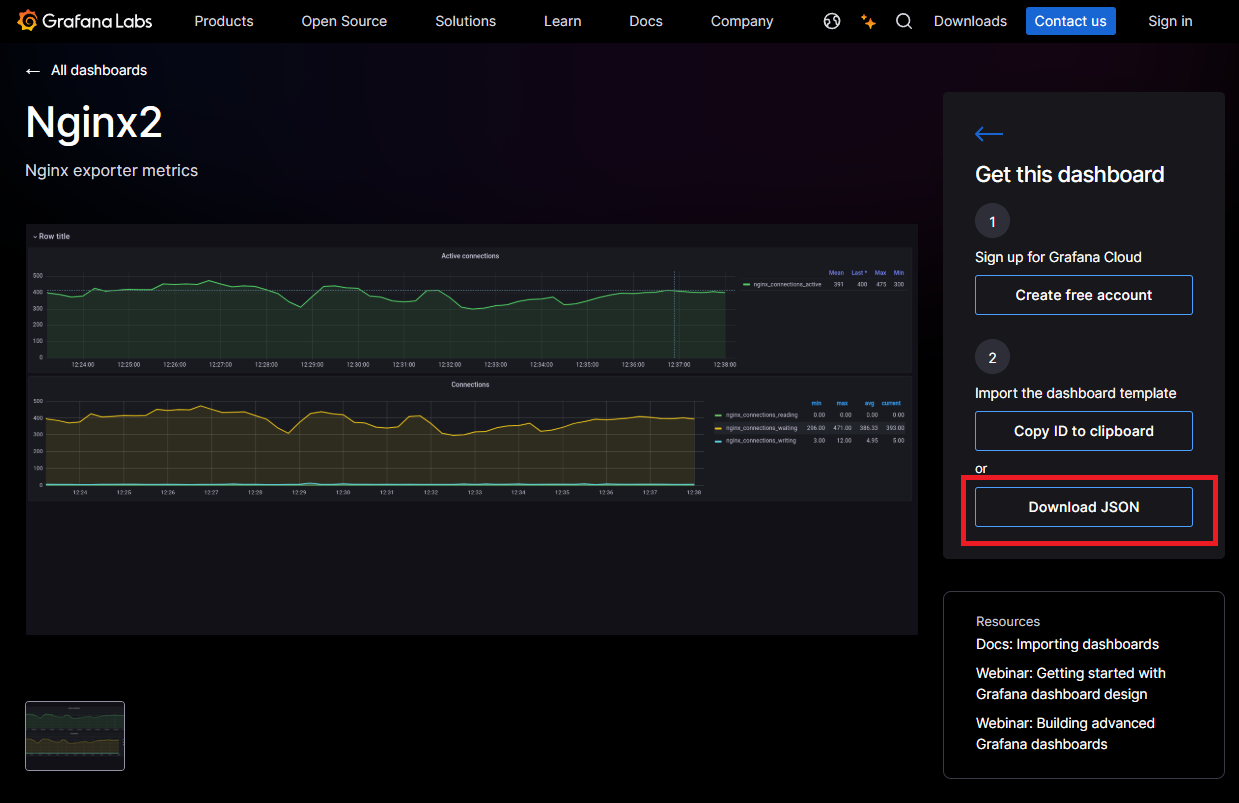
You can download a ready-made dashboard template from the Grafana Dashboard marketplace to display Nginx metrics.
Download a Dashboard Template
Importing the Dashboard Template
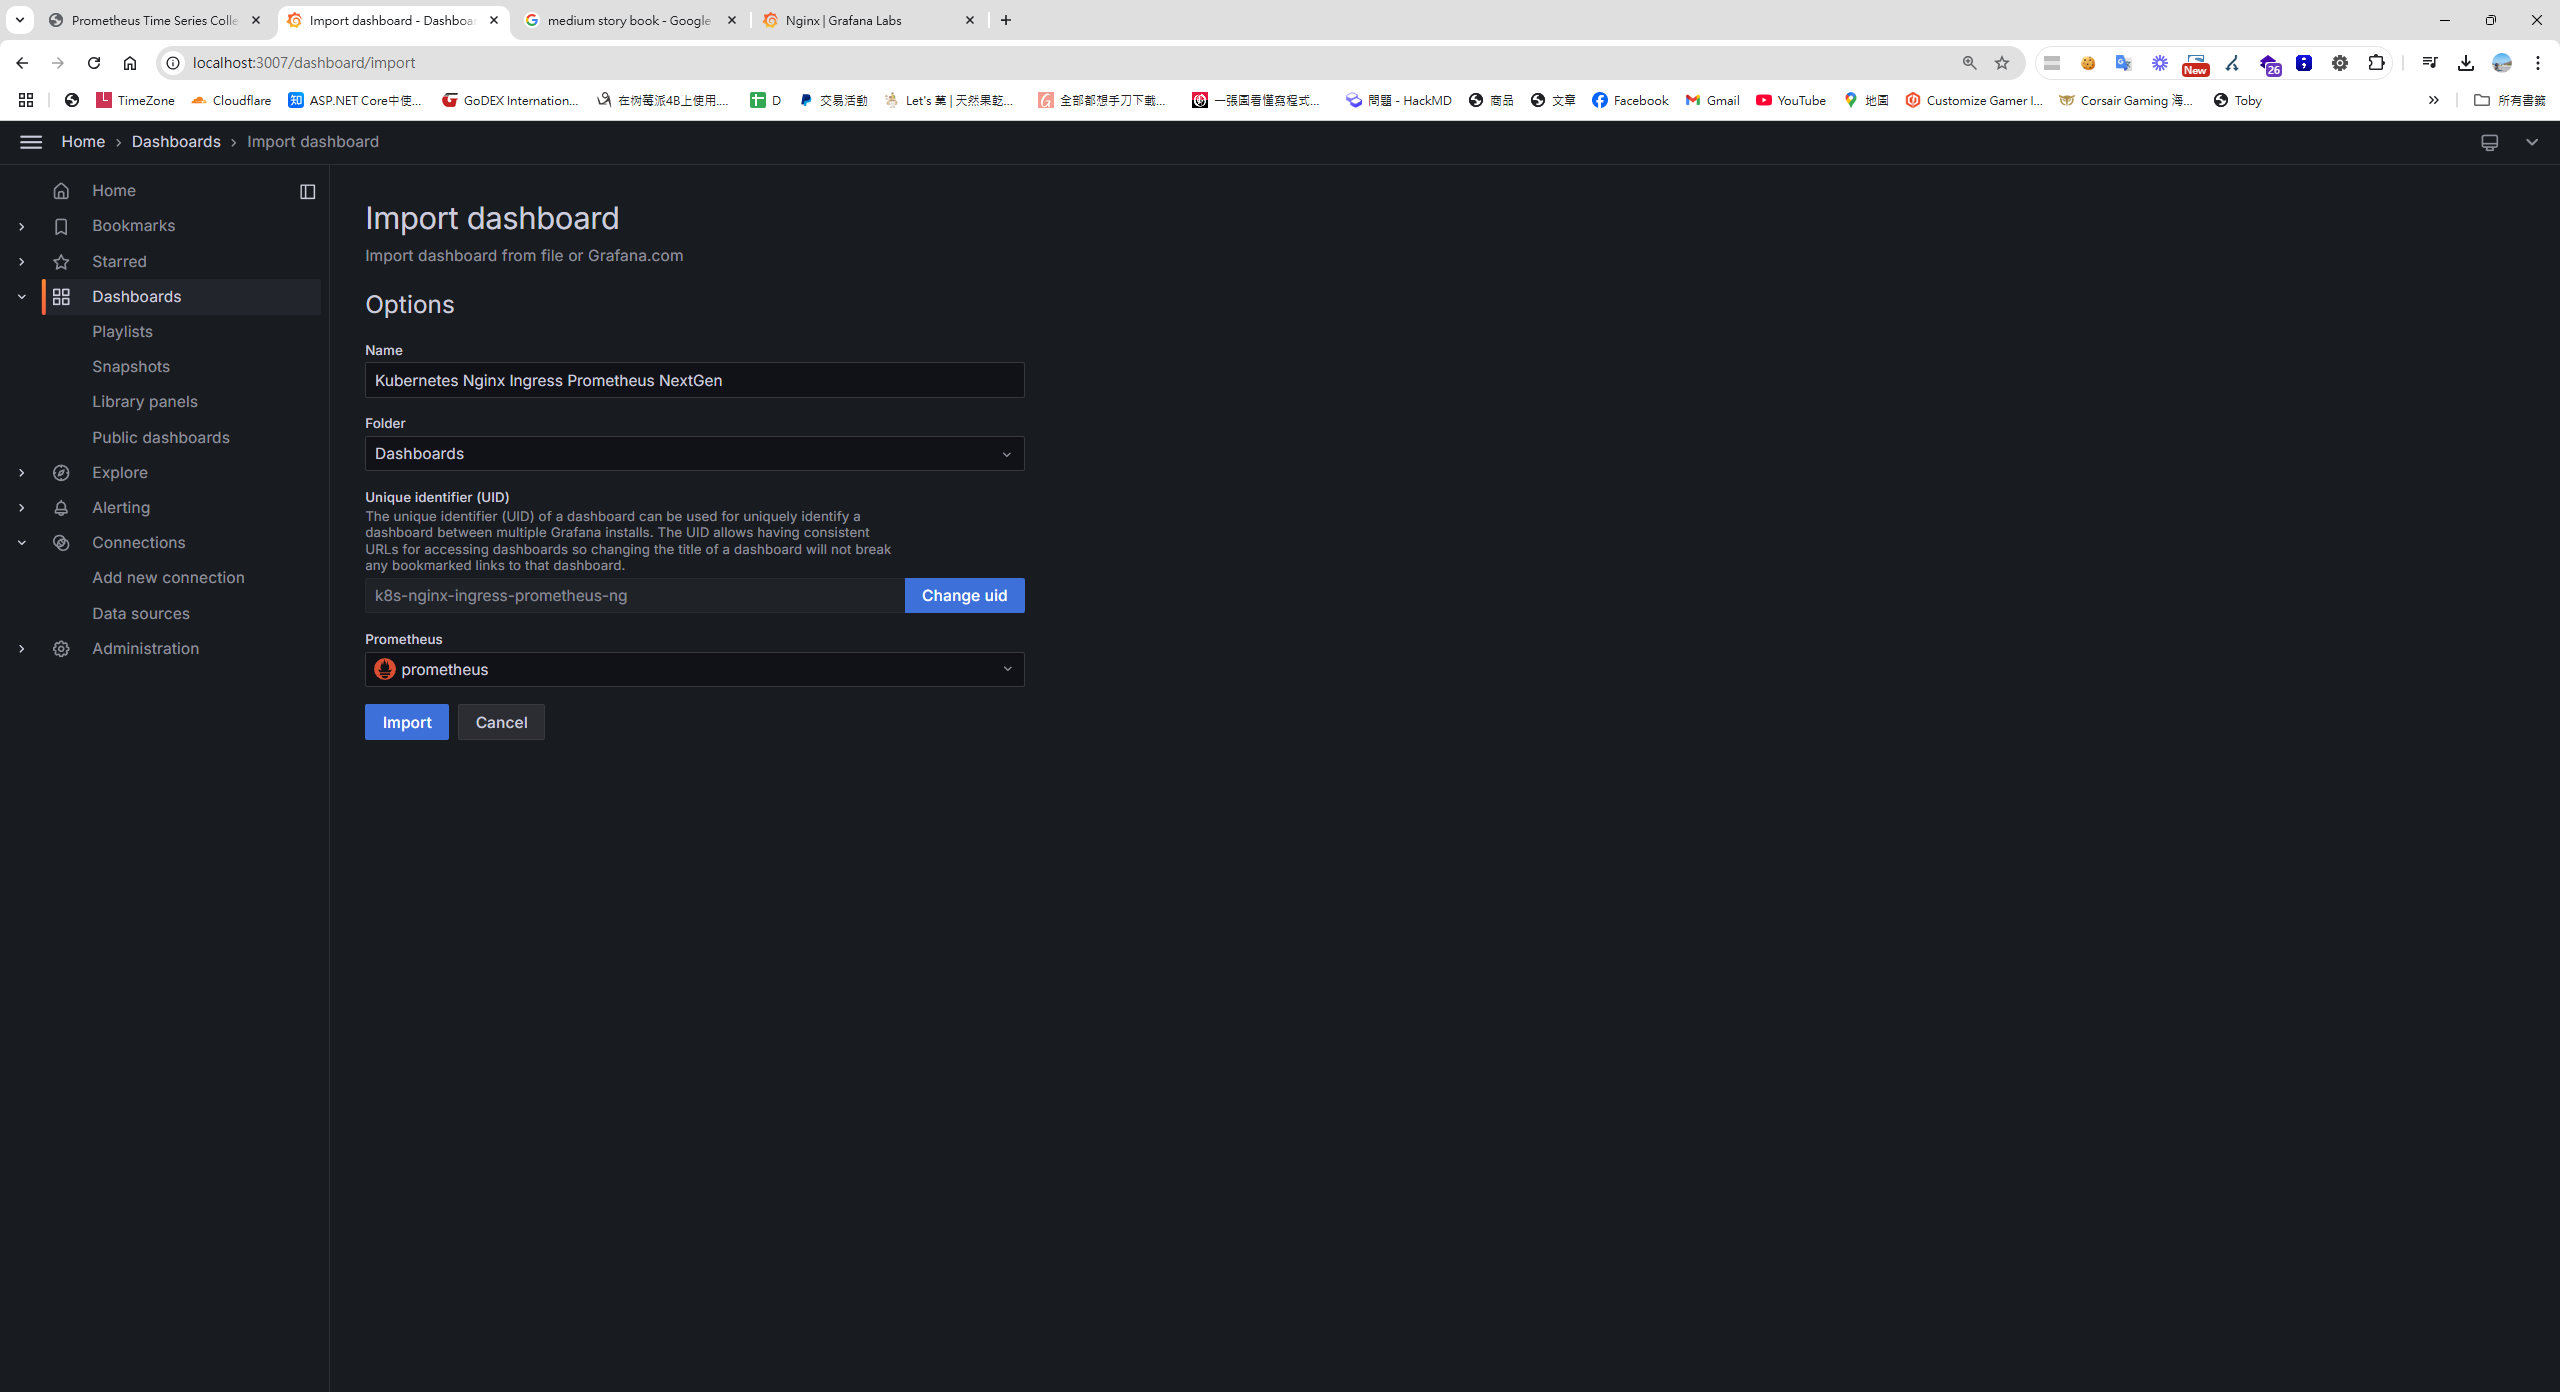
Back in Grafana, click "New Import" and import the JSON template you downloaded.
Running a K6 Load Test
Write a K6 load test script to simulate traffic and validate Nginx performance:
import http from 'k6/http';
import { check, sleep } from 'k6';

export const options = {
  stages: [
    { duration: '30s', target: 3000 },  // 負載測試從 0 到 3000 個虛擬使用者,持續 30 秒
    { duration: '1m30s', target: 3000 }, // 維持 3000 個虛擬使用者,持續 1 分 30 秒
    { duration: '20s', target: 0 },      // 減少虛擬使用者數量
  ]
};

export default function () {
  const res = http.get('http://192.168.0.88:8885/nginx_status'); // your nginx ip
  check(res, { 'status was 200': (r) => r.status == 200 });
  sleep(1);
}
Using the Docker-based K6 image means no local installation required:
// Windows 腳本
cat script.js | docker run --rm -i grafana/k6 run -
Viewing Live Data in Grafana
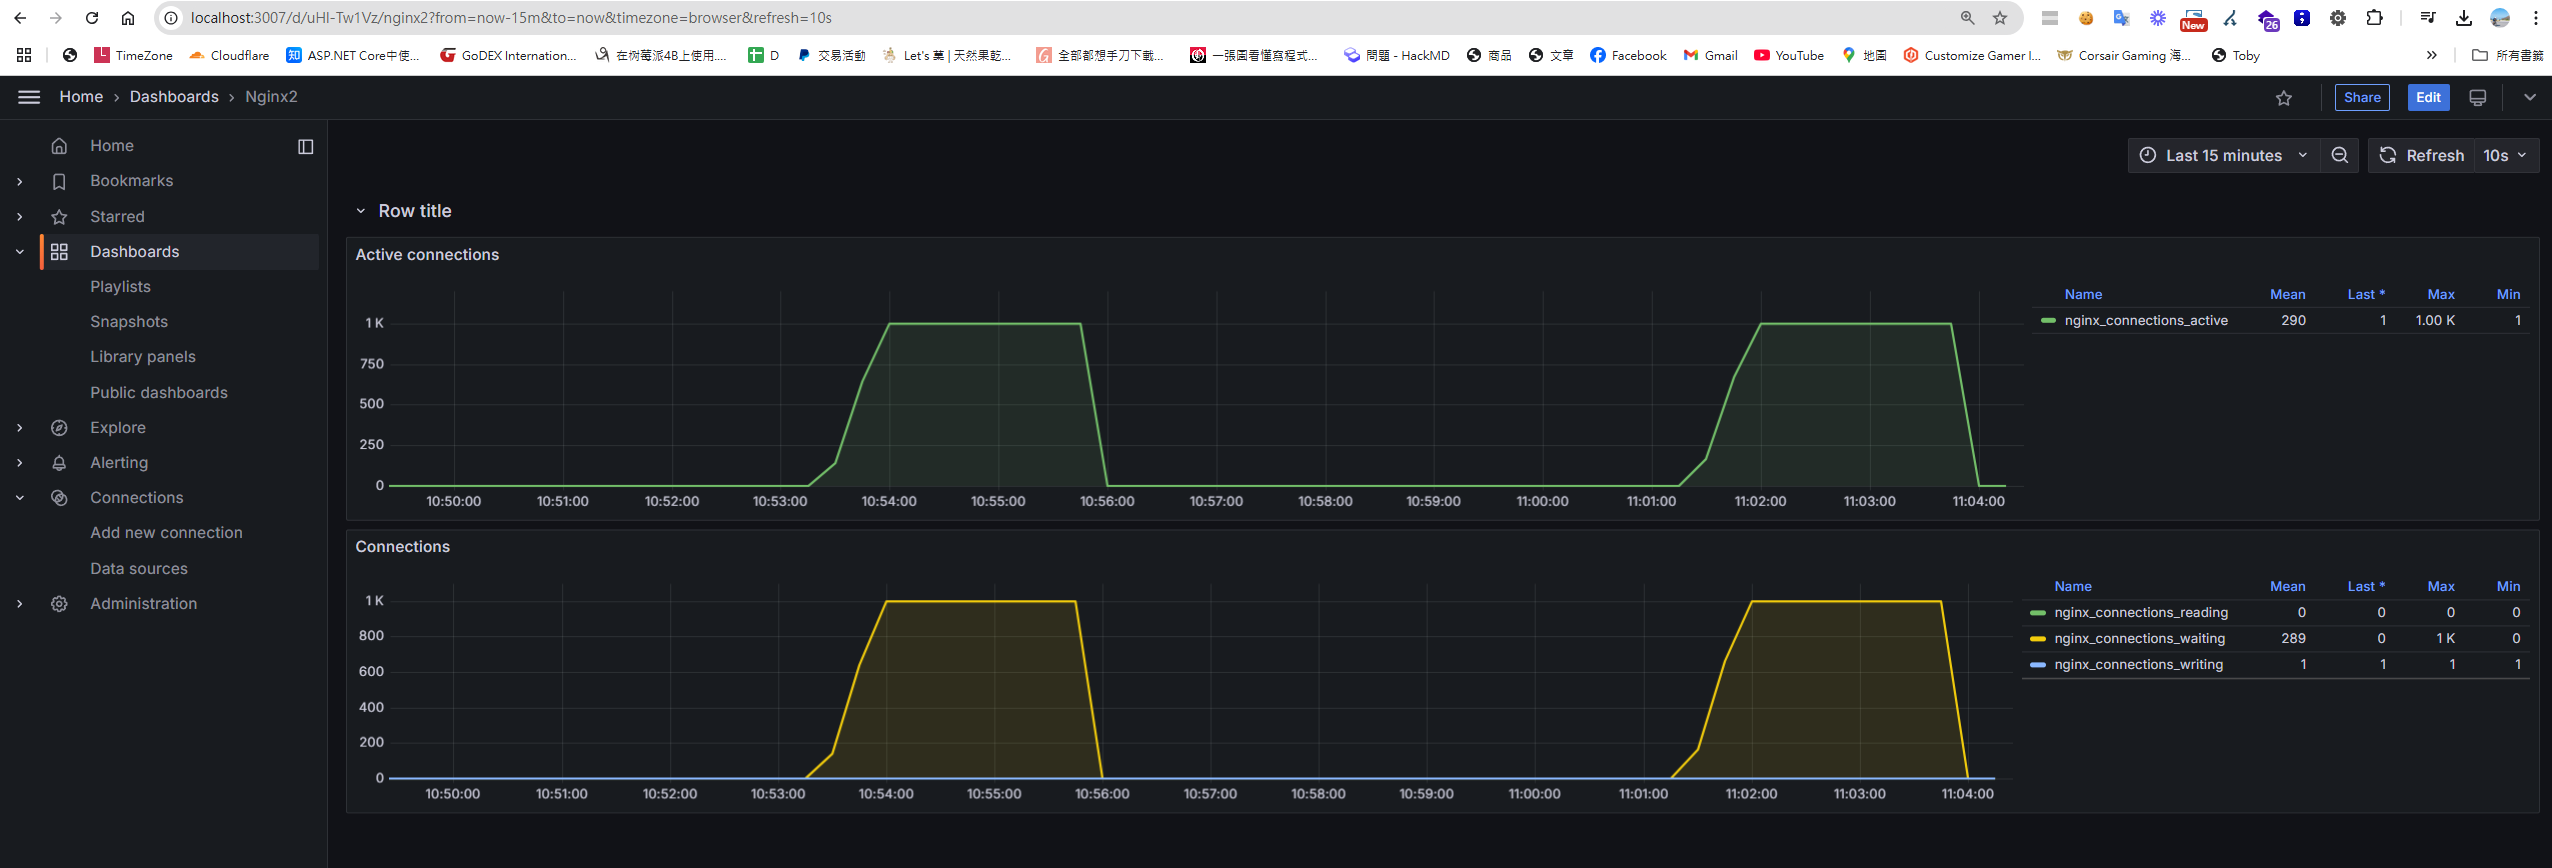
After running the load test, the Grafana dashboard will display live Nginx metrics such as active connection counts.
Source Code
All code and configuration files are available on GitHub.


Comments