
Introduction
In a previous article, we showed how to use Prometheus to monitor Nginx performance. With the growing popularity of containerization, monitoring Docker container resource usage is equally important. This article will introduce how to use cAdvisor (Container Advisor) in combination with Prometheus and Grafana to comprehensively monitor Docker container resources like CPU, memory, disk, and network.
What is cAdvisor?
cAdvisor is an open-source tool developed by Google for real-time monitoring of container resource usage and performance data. Compared to basic Docker commands (like docker stats), cAdvisor provides more detailed data and a graphical interface for querying, and it integrates seamlessly with Prometheus and Grafana.
Installing and Deploying cAdvisor
First, we need to start the cAdvisor container to collect Docker resource data.
Starting the cAdvisor Container
Use the following command to start the cAdvisor container:
docker run \
  --volume=/:/rootfs:ro \
  --volume=/var/run:/var/run:rw \
  --volume=/sys:/sys:ro \
  --volume=/var/lib/docker/:/var/lib/docker:ro \
  --publish=8884:8080 \
  --detach=true \
  --name=cadvisor \
  google/cadvisor:latest
This will start cAdvisor on local port 8884.
Accessing cAdvisor
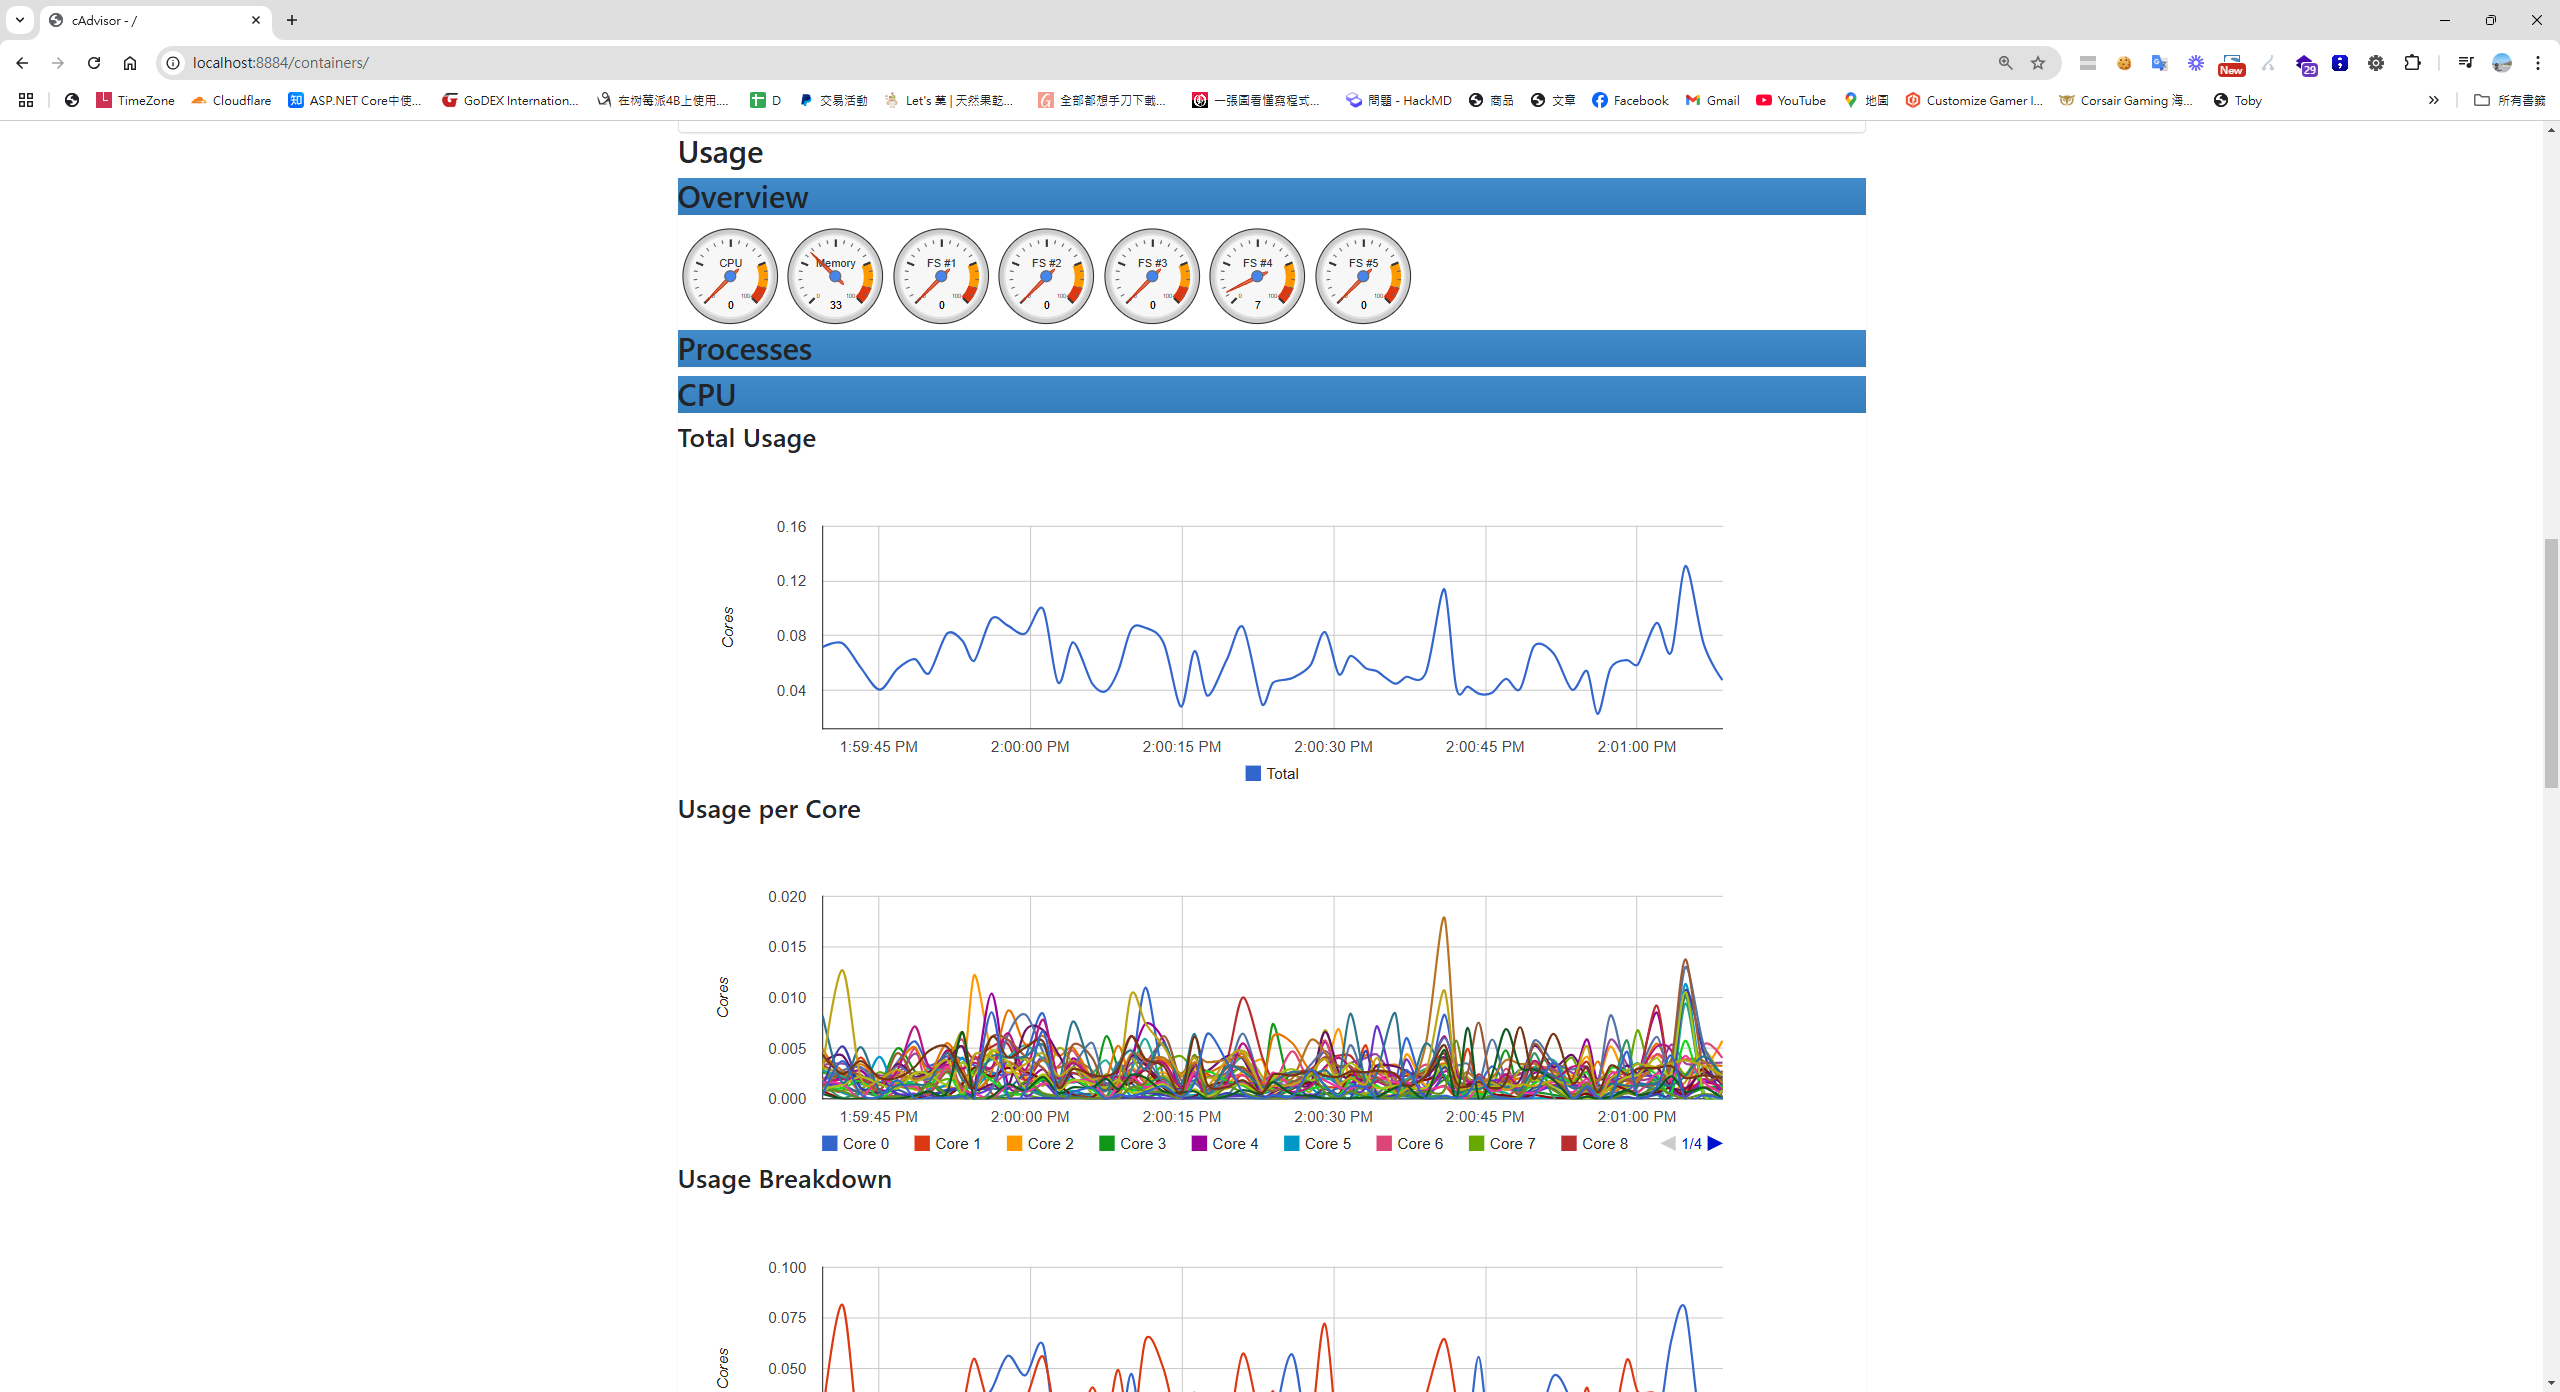
After it starts, open your browser and navigate to http://localhost:8884 to check the cAdvisor dashboard, as shown in the image below:
Configuring Prometheus to Monitor cAdvisor
Next, we'll modify the Prometheus configuration file to add a scrape job for cAdvisor.
Refer to the config files in the Github Repo from the previous article on monitoring Nginx with Prometheus
Copy the Prometheus scraper configuration file prometheus.yaml, rename it to prometheus-with-cadvisor.yaml, and add the following content to the configuration file:
- job_name: "cadvisor"
  static_configs:
    - targets: ["cadvisor:8080"]  # cAdvisor 的服務地址和埠號
Copy the deployment configuration file deployment.yaml and rename it to deployment-with-cadvisor.yaml.
  cadvisor:
    image: gcr.io/cadvisor/cadvisor:latest
    container_name: cadvisor
    ports:
      - "8884:8080" # cAdvisor 預設埠號
    volumes:
      - /:/rootfs:ro
      - /var/run:/var/run:rw
      - /sys:/sys:ro
      - /var/lib/docker/:/var/lib/docker:ro
Build and run the containers.
docker-compose -f ./deployment-with-cadvisor.yaml up -d
Verifying the Prometheus Configuration
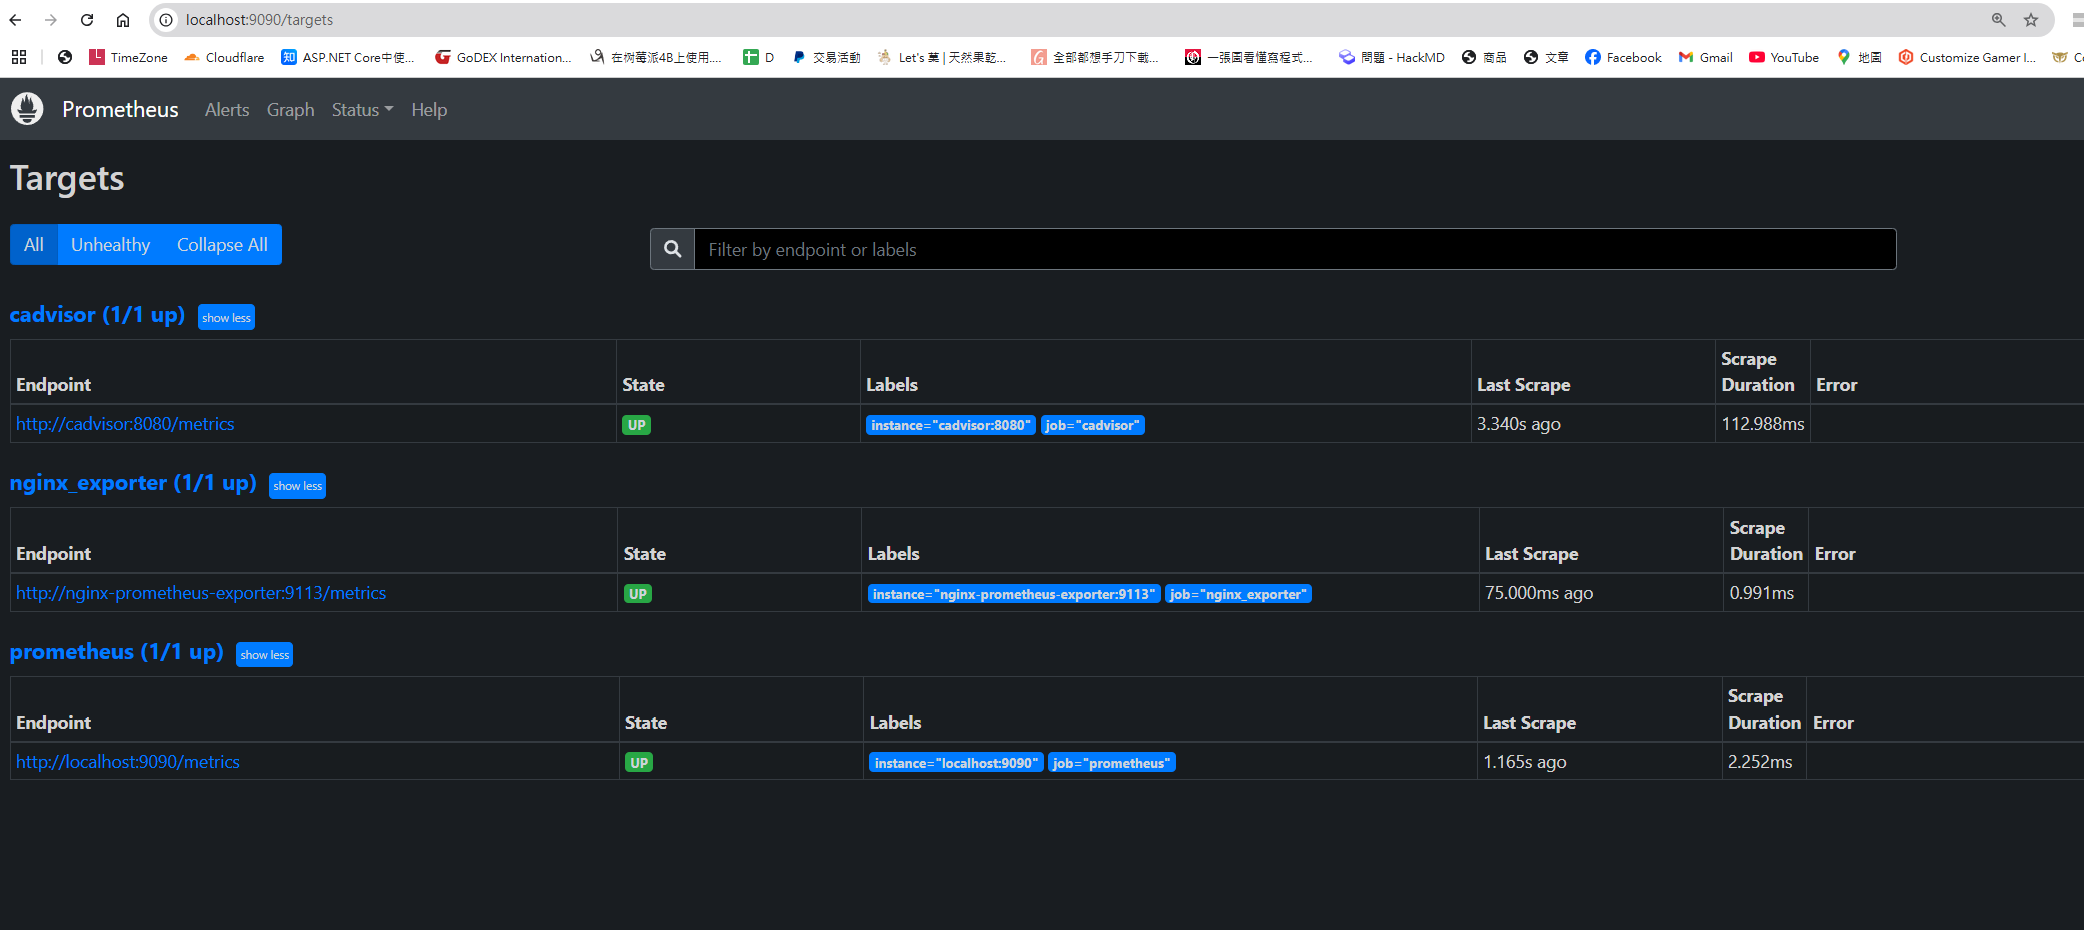
Check the Prometheus scraper Targets page at http://localhost:9090/targets to confirm that cAdvisor has been discovered and is being scraped correctly:
Visualizing Data with Grafana
Grafana provides powerful data visualization capabilities. Here are the steps to integrate cAdvisor data into a Grafana dashboard:
Download a Grafana Dashboard
Download the cAdvisor dashboard from the official Grafana Dashboards site.
Import the Dashboard
Go to your Grafana dashboard, click "Import," and upload the downloaded JSON file to Grafana.
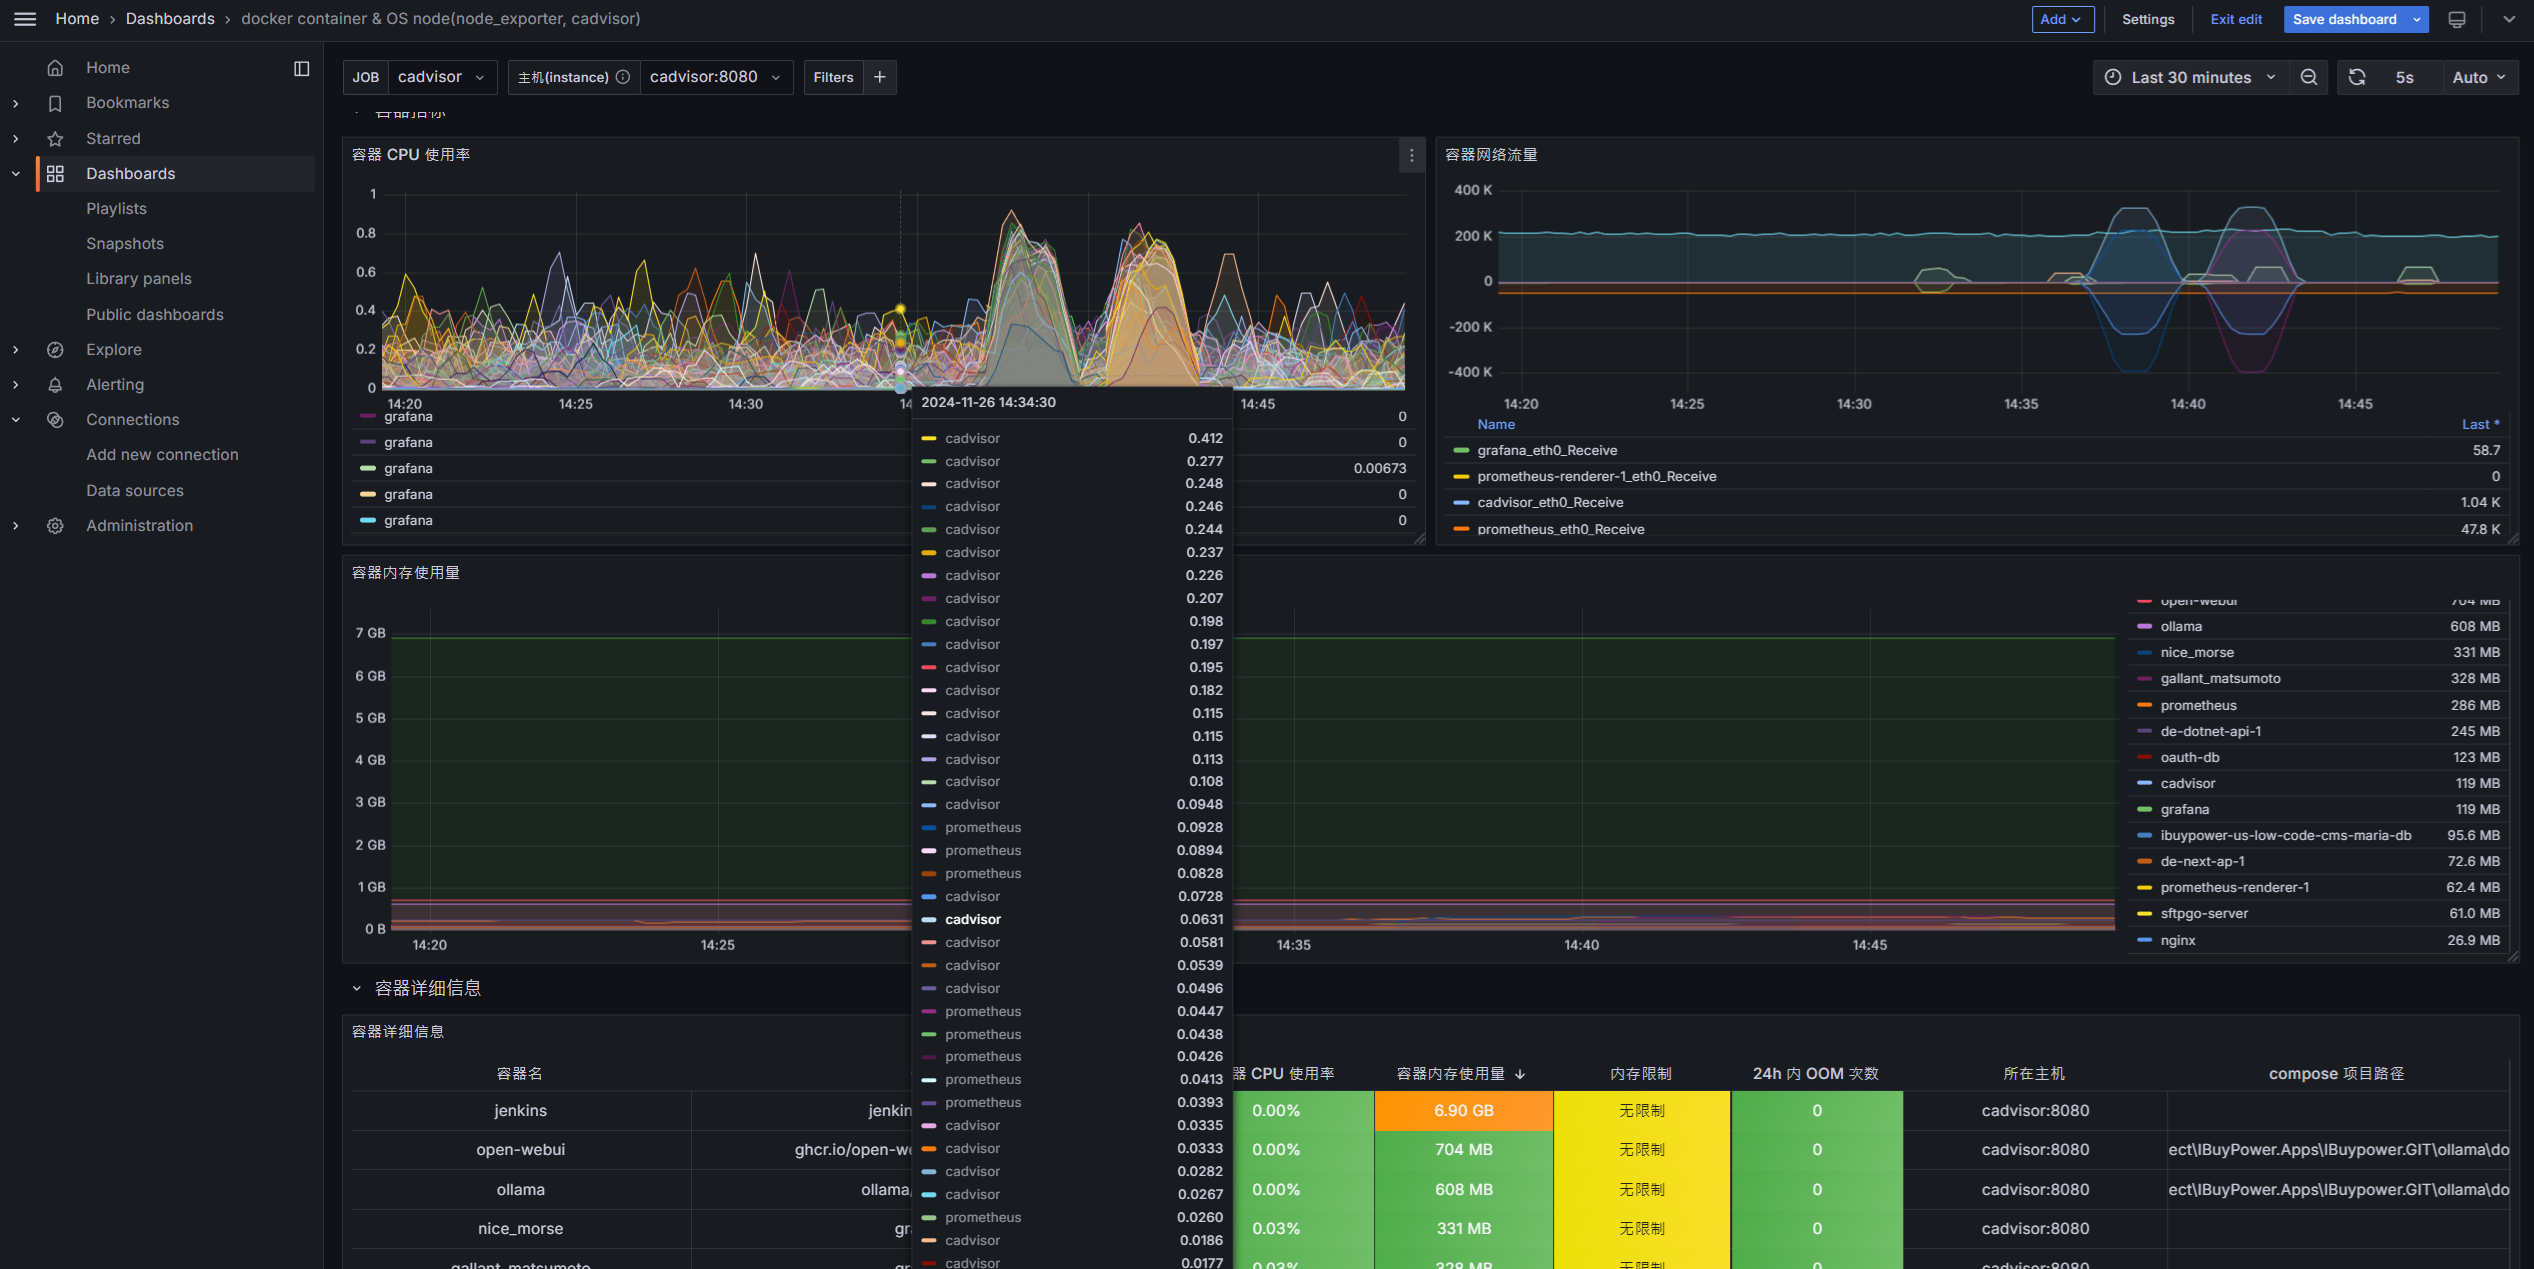
Once the import is complete, you will see real-time container monitoring data, including CPU, memory, disk, and network usage.
Summary
By combining cAdvisor, Prometheus, and Grafana, we can achieve comprehensive monitoring of Docker container resources, helping us manage and optimize containerized applications more efficiently.


Comments