Mark Ku's Blog

The Problem

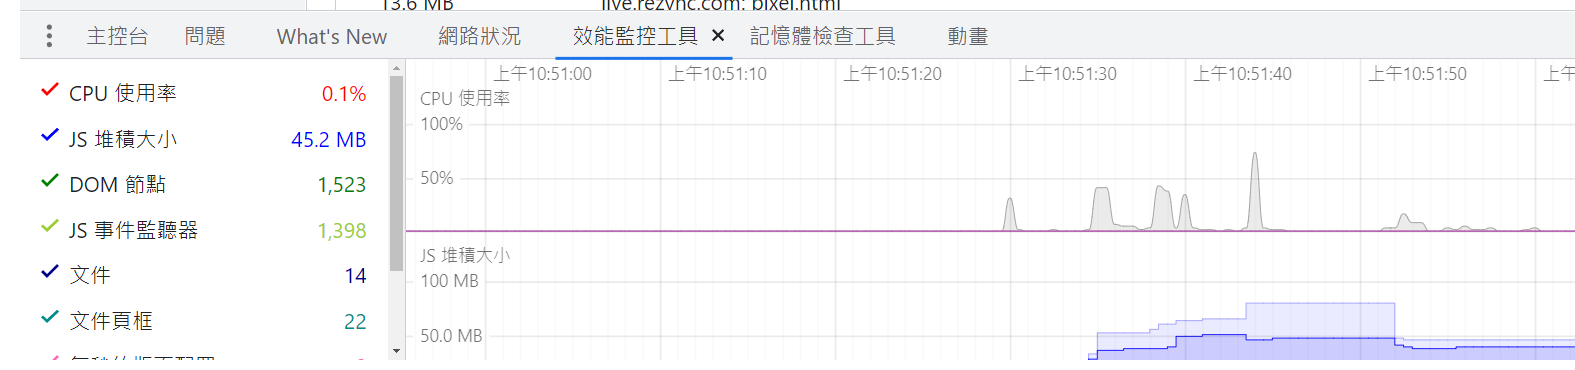
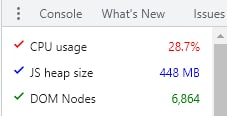
While developing a small front-end animated web game, I noticed that after leaving the auto-play feature running overnight, memory usage would spike to 1GB. Developer console with CPU, JS heap, DOM node performance metrics
Before Investigating, Let's Understand Memory Leaks

In computer science, a memory leak is a type of resource leak that occurs when a computer program incorrectly manages memory allocations in such a way that memory which is no longer needed is not released. (Wikipedia)

Understanding the Browser's Garbage Collection Mechanism

Browsers use a reference counting algorithm. Data that is no longer referenced is marked, and a periodic process runs to release that memory.

Using Two Chrome Tools to Analyze the Memory Leak

1. Performance Monitor

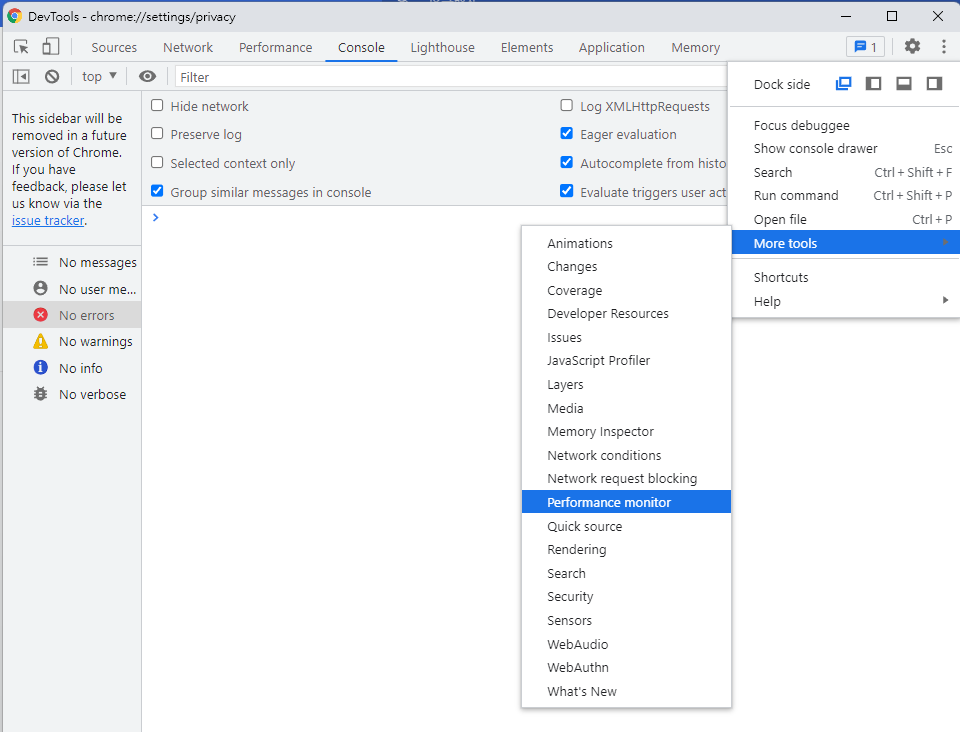
  1. Open Chrome > F12 > More Tools > Performance Monitor Chrome DevTools navigating to Performance monitor via More tools menuChrome DevTools Performance Monitor showing CPU and JS heap graphs
2. Memory Snapshot

Open Chrome > F12 > Memory
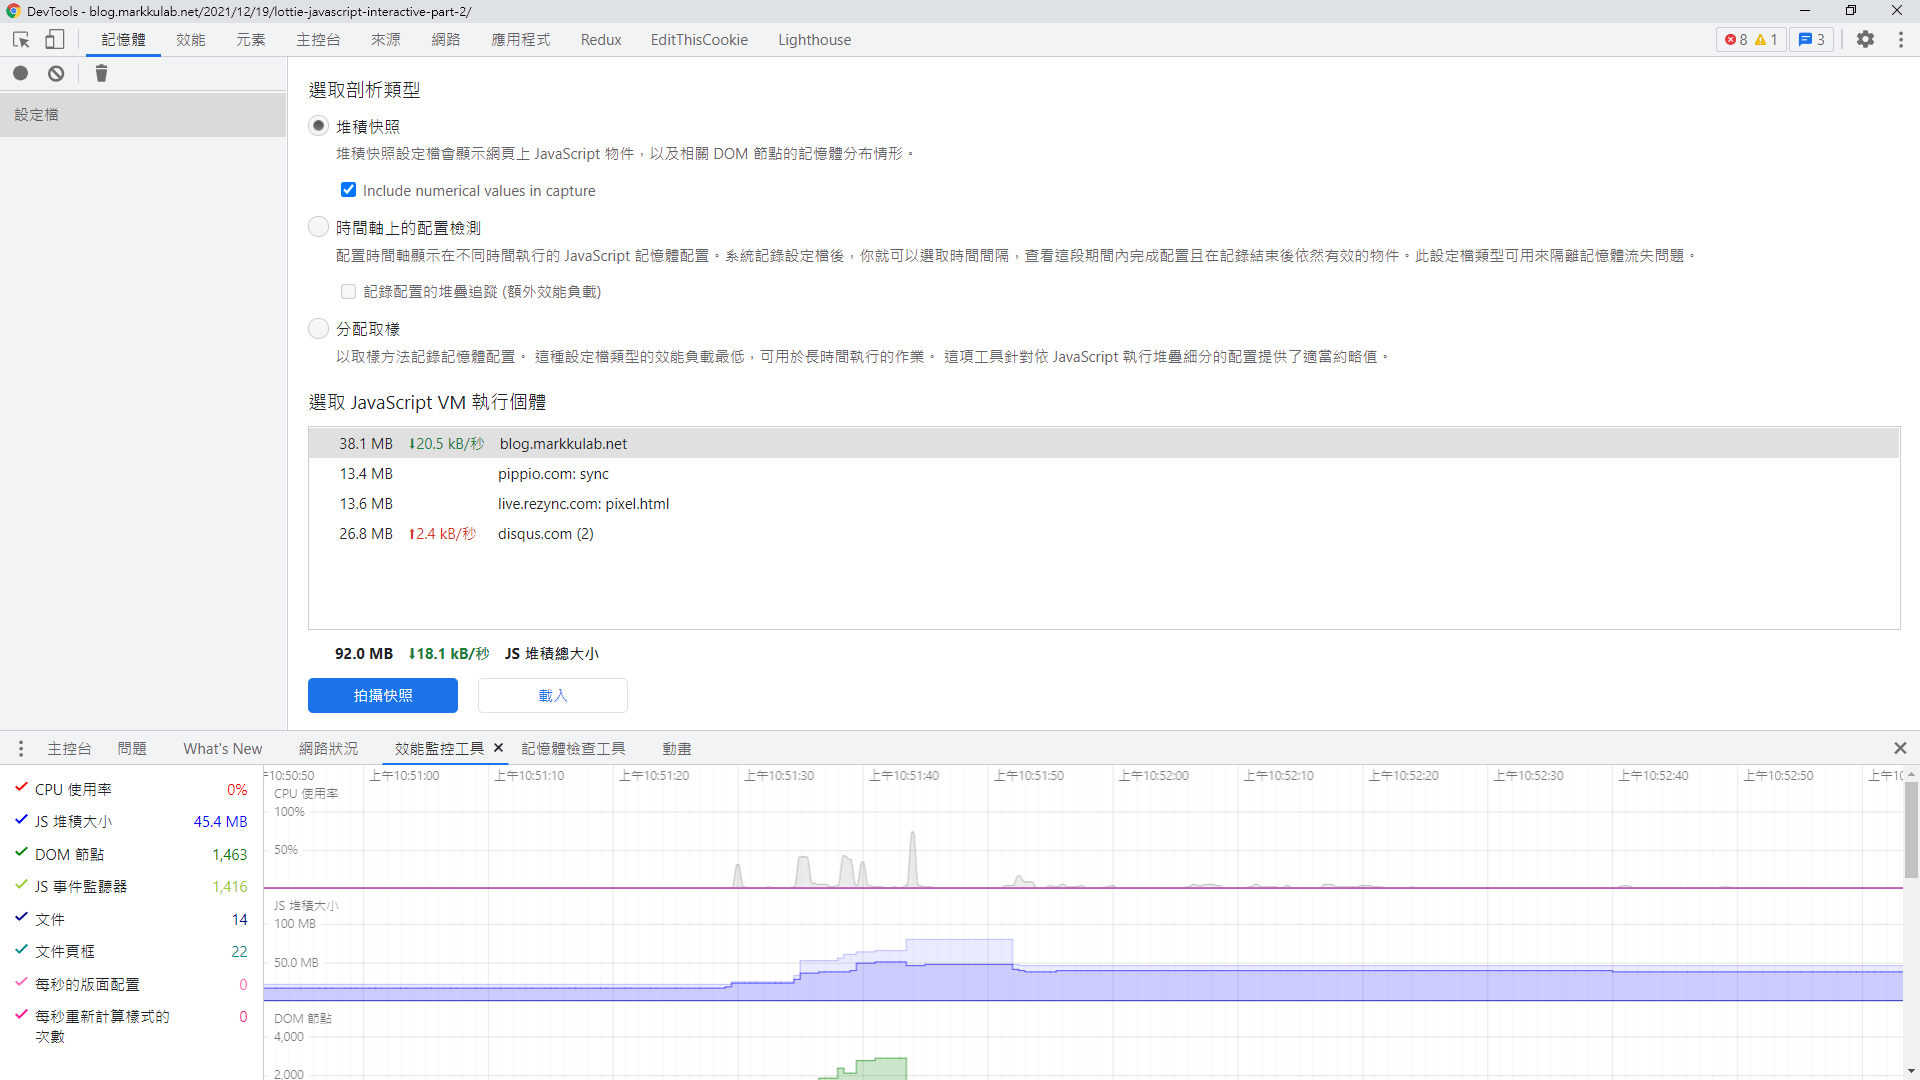
Chrome DevTools Memory panel showing JavaScript heap size and profiling

Testing Methods

  1. Refresh the page several times to see if memory usage drops (i.e., if it's being released).
  2. Leave it running for a long time to see if memory usage grows.
  3. Compare scenarios with and without keep-alive.
  4. Use memory snapshots to analyze which JS objects are continuously growing.

I Made Adjustments Primarily Based on This Article About Common Memory Leaks

Link

In the End, I Made Two Adjustments

1. Manually call destroy before a custom component with the Lottie-web animation library is unmounted (via v-if).

beforeDestroy () {
this.lottieAnimation.destroy('game-animation')
this.lottieAnimation = null
this.lottieApi = null
}

2. Because Vue's keep-alive only allows for forcefully clearing the cache, I ultimately decided to remove it. This reduced average memory usage by 30 MB, and after running tests overnight, the memory spike issue was gone.

In Conclusion

After leaving it running overnight, the memory usage finally stopped spiking.

Author

Mark Ku

擁有 10+ 年經驗的資深軟體工程師,現為 AI 應用 Builder,專注於大型平台架構與簡化複雜系統設計,從電商系統到訂閱與收費平台,結合 AI Agent、AI 整合與自動化開發,打造高效率且可持續演進的產品技術基礎。Read More

Found this useful?

The author's free tools, daily podcasts and newsletter are all here.

Mark Ku · This article is licensed under CC BY 4.0. Credit the author and link back to the original when reusing it.

Comments

Subscribe to Newsletter

Subscribe to get new posts delivered instantly — never miss a tech share.

By submitting, you agree to receive emails. You can anytime.

Popular Posts

View all
Mark Ku
··602

Oracle Cloud Always Free Tier: Linux Host and Static IP for a $0 Cloud Solution

Oracle Cloud Always Free Tier: Linux Host and Static IP for a $0 Cloud Solution
Mark Ku
··490

Say Goodbye to Postman's Fee Trap! A Hands-on Guide to Bruno, the Open-Source Git-Native API Testing Powerhouse.

Say Goodbye to Postman's Fee Trap! A Hands-on Guide to Bruno, the Open-Source Git-Native API Testing Powerhouse.
Mark Ku
··333

A Free, Open-Source, Notion-like Knowledge Base — A Complete Guide to Deploying and Backing Up Outline Wiki

A Free, Open-Source, Notion-like Knowledge Base — A Complete Guide to Deploying and Backing Up Outline Wiki
Mark Ku
··264

Training Your Own AI Voice: Hardware Requirements, Open-Source Model Comparison, and LoRA Fine-Tuning

Training Your Own AI Voice: Hardware Requirements, Open-Source Model Comparison, and LoRA Fine-Tuning
Mark Ku
··221

Building an Efficient API Management Platform: Deploying Kong Gateway from Scratch - Part 1

Building an Efficient API Management Platform: Deploying Kong Gateway from Scratch - Part 1
Mark Ku
··215

Setting Up Samba on Ubuntu to Share Folders with Windows 11

Setting Up Samba on Ubuntu to Share Folders with Windows 11