
Over the past six months, I participated in the first-phase build of a mid-to-large system project, mainly responsible for API Gateway architecture evaluation and PoC validation.
It wasn't just standing up services. The real challenge was: how do you design a single external entry point for a pile of services with different characteristics, while balancing security, observability, and high availability?
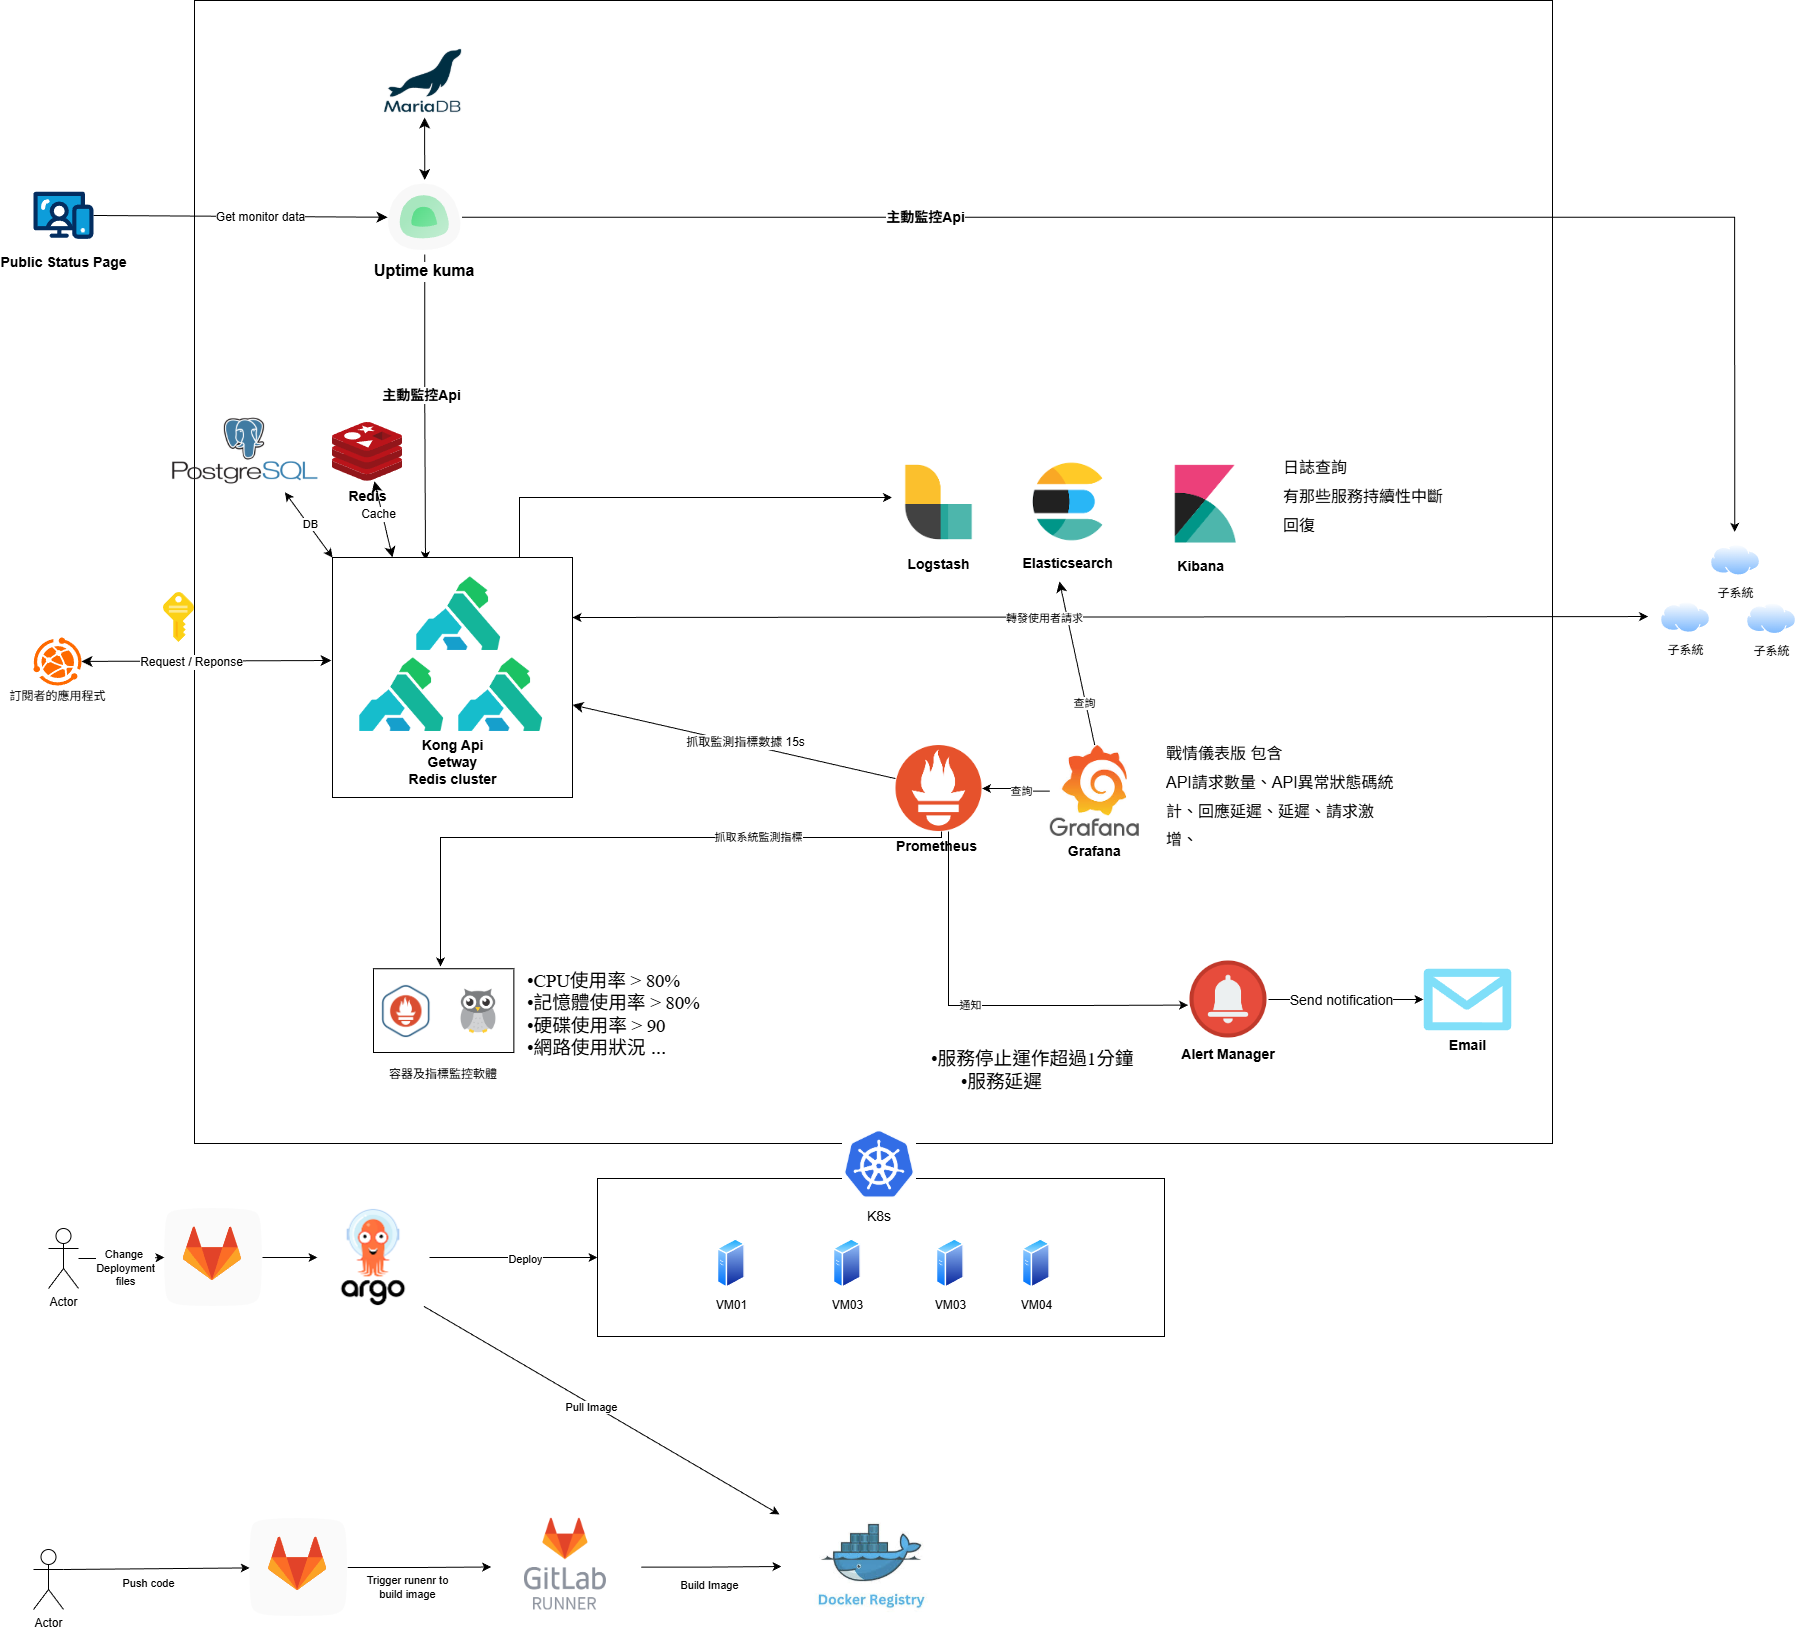
Project background and goals
The client owns a large number of internal API services and wants to expose them externally and commercialize them through digital transformation. The core goal: build a self-service API rental platform where developers can quickly apply, pay-as-you-go, and use the APIs. The first phase was to evaluate solutions and architecture before formal system development — to validate whether the requirements could be met.
Pain points before adoption
| Aspect | Problem |
|---|---|
| Process efficiency | Paper-based applications, multi-layer approvals, IP binding — key issuance took ages |
| Usage tracking | No unified monitoring; no idea who's using how much, can't track |
| Security & stability | Lack of unified authentication, no rate limiting, hard to localize issues |
| System integration | Subsystems acted independently; high integration cost for developers |
Value after adoption
What the API Gateway delivers:
- Efficiency boost: API Key application time dropped from days to minutes
- Transparent billing: Real-time usage stats supporting tiered plans
- Unified entry point: One Gateway for all APIs — lower learning curve
- Automated ops: Rate Limiting, ACL run automatically; centralized monitoring of anomalies
1. Core architecture: why Kong?
In the evaluation phase, we needed something that could handle high concurrency, support a rich plugin ecosystem, and integrate natively with Kubernetes. We ended up with Kong API Gateway paired with Redis and PostgreSQL as the core stack.
According to our architecture plan:
- Traffic entry: All external requests are handled uniformly by Kong.
- State management: Redis handles Kong's cache and Rate Limiting state.
- Configuration storage: PostgreSQL stores routes and plugin configs for persistence.
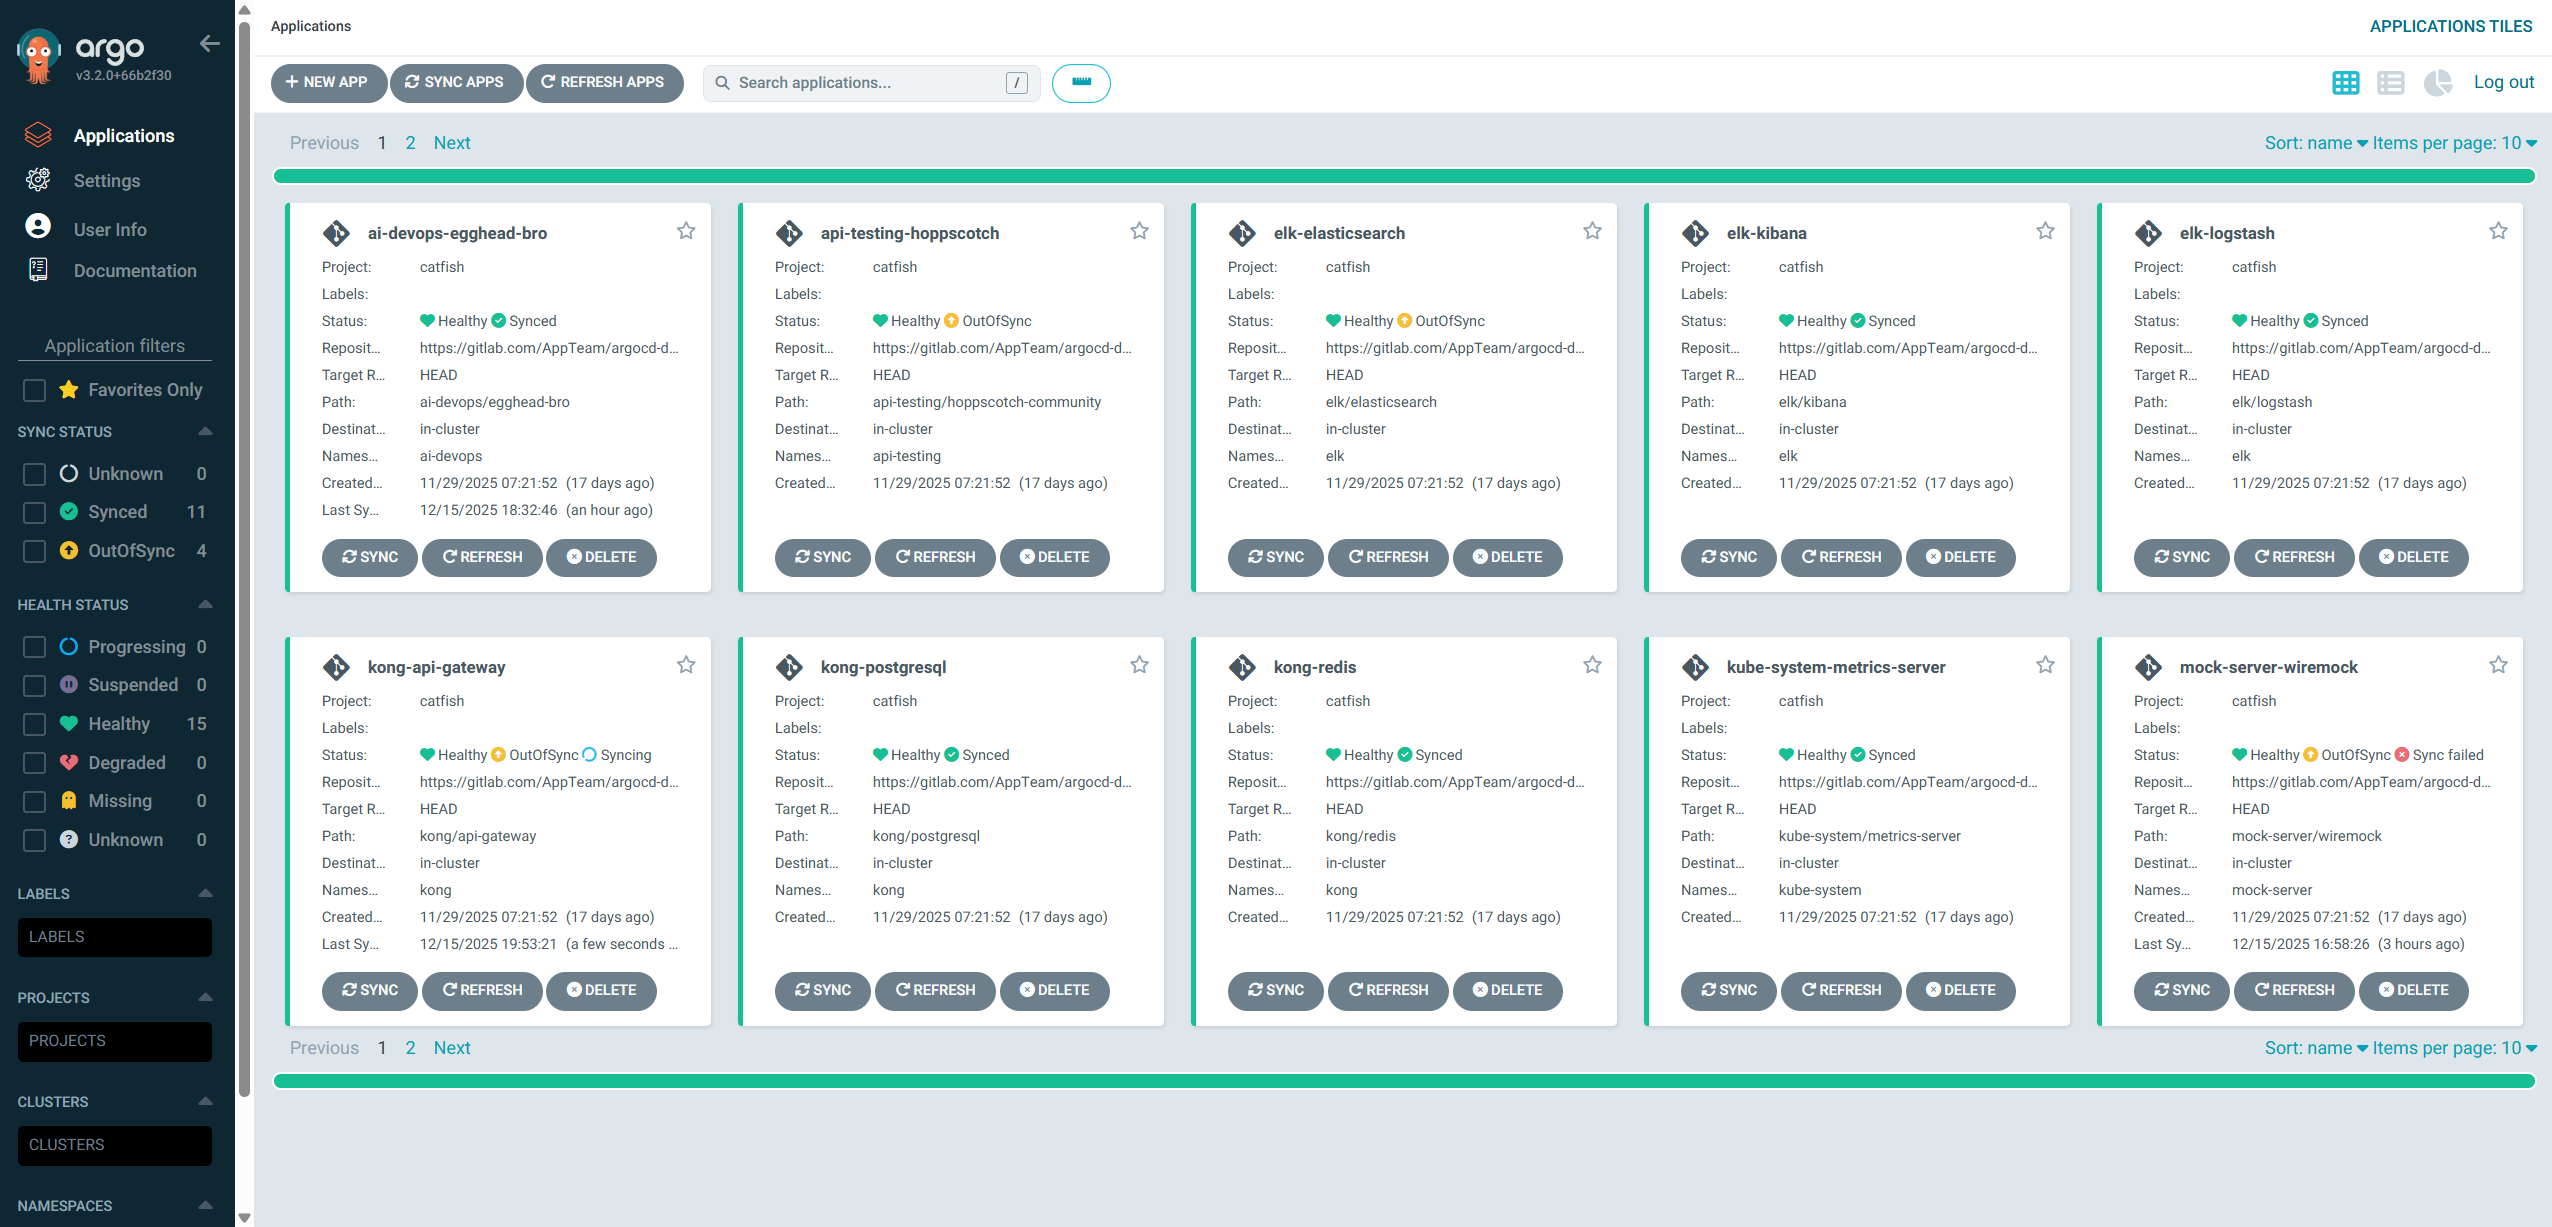
- GitOps flow: GitLab CI/CD + ArgoCD sync configs to the K8s environment.
Infrastructure
For this architecture validation environment, we deployed on Google Cloud Platform (GCP) virtual machines, using RKE (Rancher Kubernetes Engine) to set up a Kubernetes Cluster ourselves for testing. RKE is Rancher's K8s install/management tool, focused on standardized, fast K8s cluster deployment on existing hosts. This let us flexibly simulate on-premises network restrictions and resource scheduling scenarios.
Automated deployment strategy (Helm & Helmfile)
We used Helmfile to manage multiple Helm Releases (Kong, Redis, Postgres, etc.). To make the architecture more robust and meet security requirements, we adopted a state-separation deployment strategy:
- Stateless services automated: Application-layer components (Kong Gateway, Kuma) are fully sync'd by GitOps.
- Stateful and sensitive data manual: For data security and persistence, Secrets and PersistentVolumes (PV/PVC) are extracted out of Helm Charts. These resources are deployed manually by ops to ensure CI/CD pipeline mistakes don't lose data or leak keys.
Performance
Per the official benchmark report, Kong Gateway can stably handle 100k+ RPS on a single 16-core machine. Even under HTTPS encryption with multi-plugin logic, it maintains single-digit ms latency — suitable for microservice architectures with strict performance demands.
2. Implementing API management
The first goal of API Gateway architecture validation: bring existing subsystem APIs under unified management.
Routing and service config
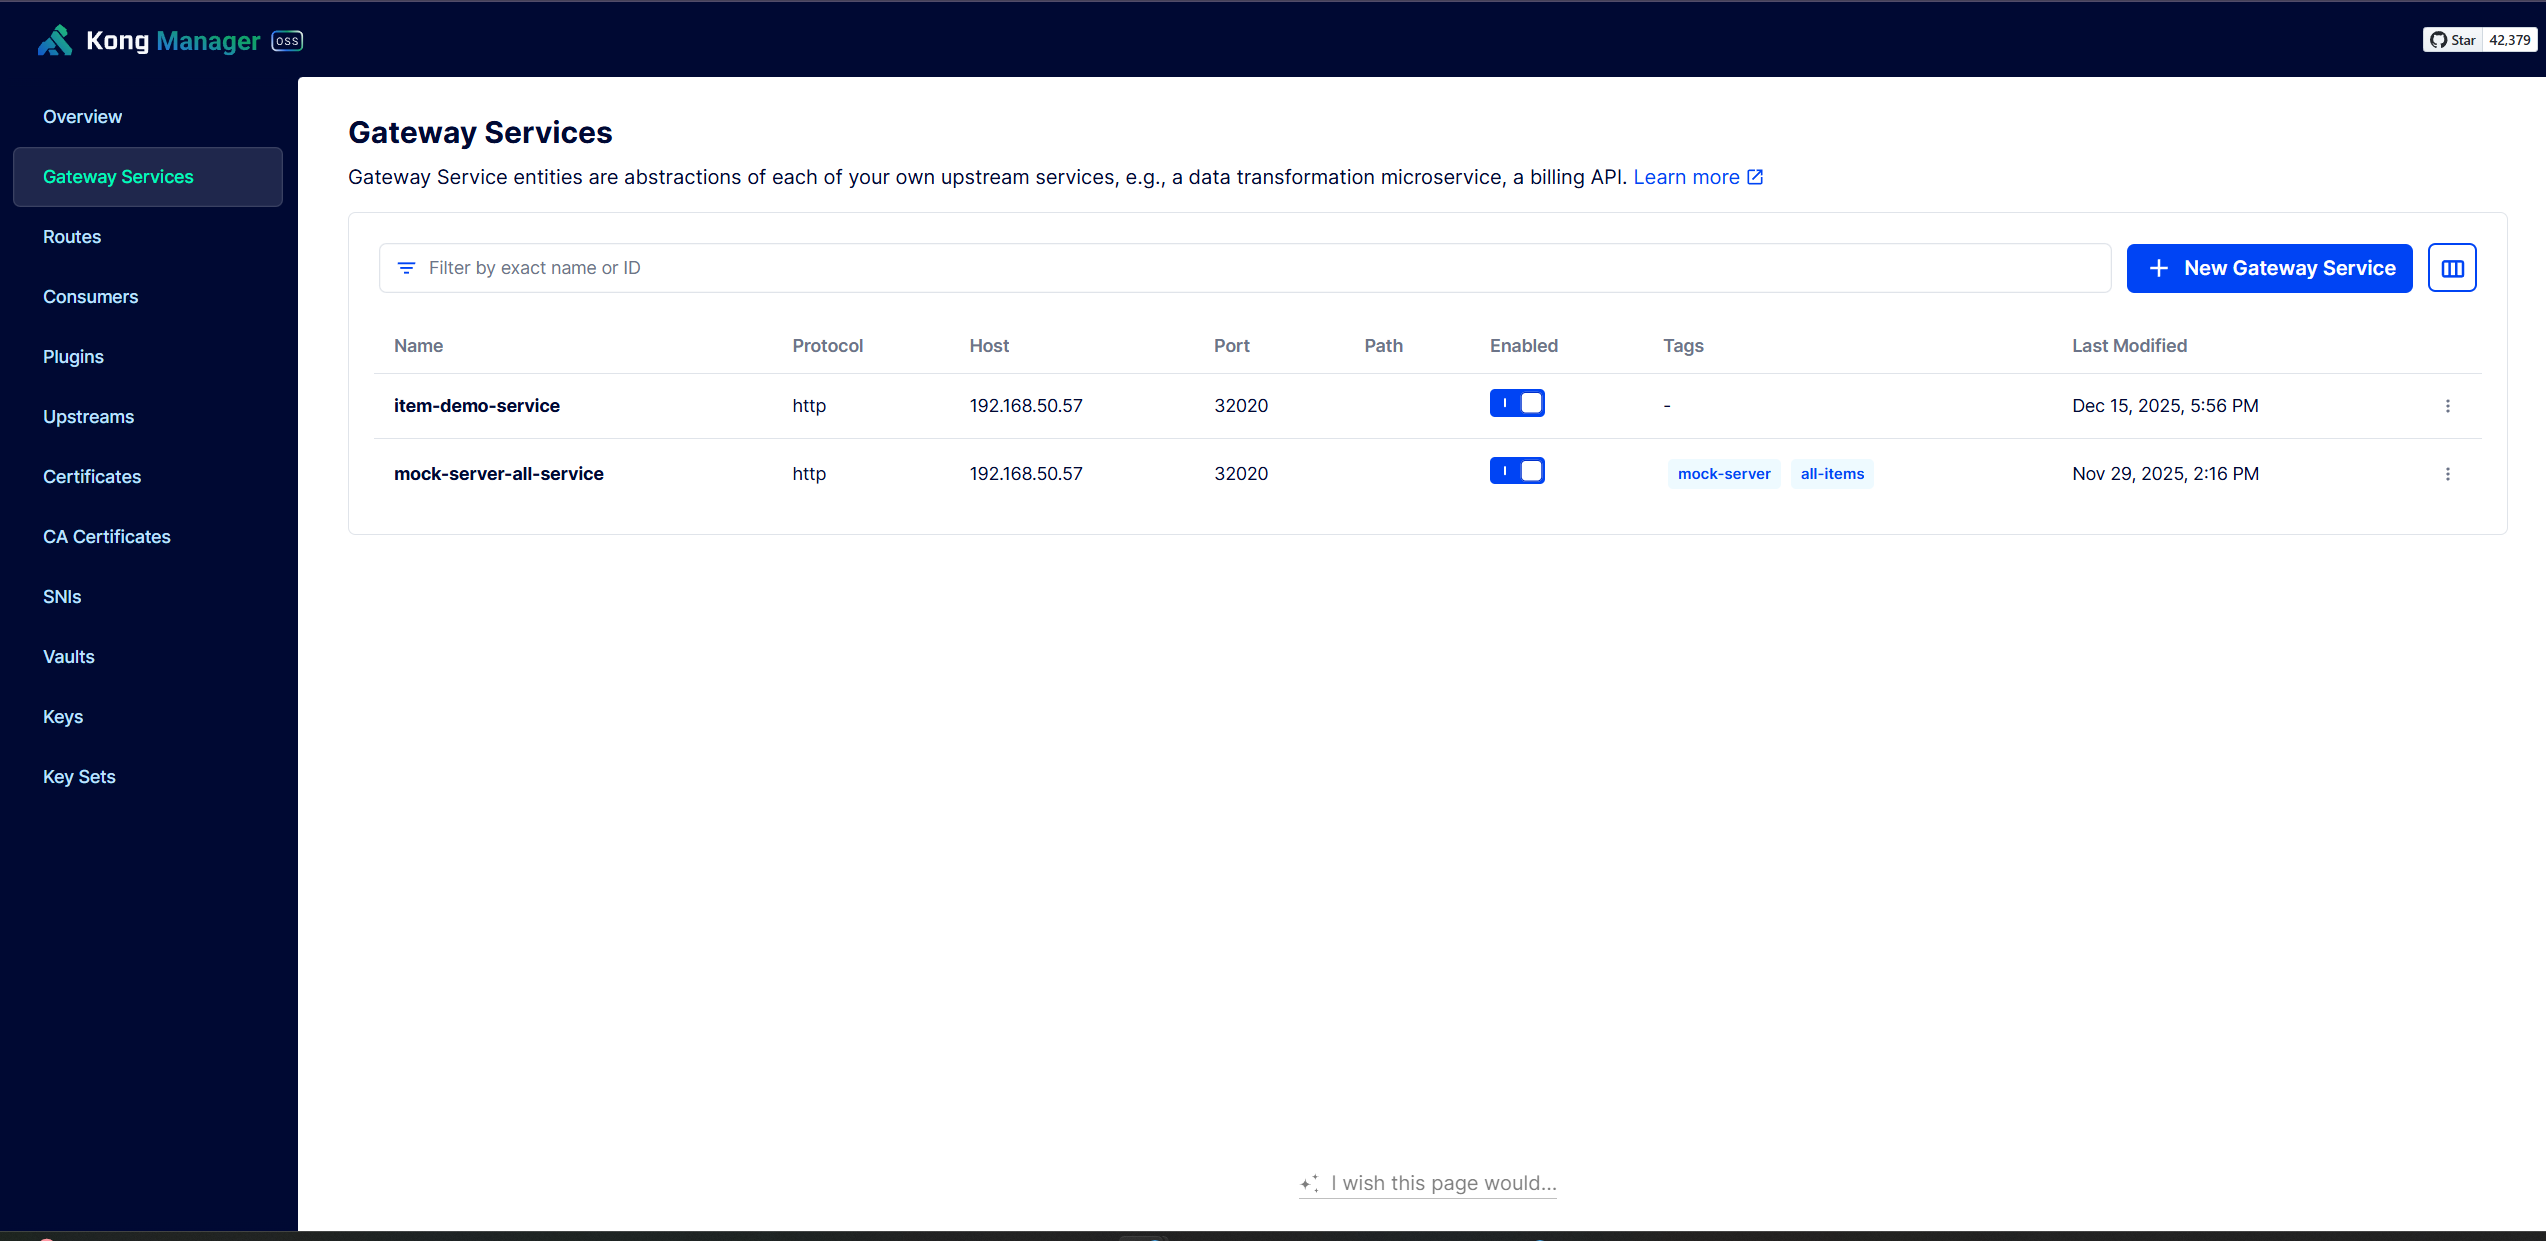
We used Kong Manager for standardized configuration:
-
Gateway Services: unified definition of backend service forwarding targets, covering multiple API protocols.
-
Working around plugin limits: Kong's mechanism doesn't allow the same plugin type on a single route twice (e.g., you can't apply two different Rate Limiting rules on one Route). We used Route Splitting to solve it. For the same Backend Service, we split into multiple Routes by URL pattern, then attached targeted traffic-control plugins to each — enabling finer-grained control.
To implement differentiated rate limiting, we adopted Route Splitting. Example: suppose the backend has an
ecommerce-service. We can split into multiple routes by Route Prefix:Route Name Path Prefix Rate Limit Purpose product-list/api/v1/products/*1000 req/min Product list query order-create/api/v1/orders/*100 req/min Order creation (compute-heavy) payment-process/api/v1/payments/*50 req/min Payment processing (sensitive) This not only lets us set differentiated limits per API, but also uses the Route Prefix to separately track usage by API category — convenient for later usage analysis, billing, and resource planning.
-
Routes and Rewrite: precise path forwarding rules. For legacy APIs, we leveraged the Request Transformer plugin with regex for URI Rewrite (e.g., forwarding
~/(wms|wmts)/(?<path>api/item/1)$), ensuring seamless old/new system integration.
💡 Important takeaway from this process: When validating an API Gateway architecture, prioritize API normalization strongly. If backend API URL structures are messy and naming is inconsistent, you can technically use the Gateway's Regex Rewrite to forward — but route configs become extremely complex and hard to maintain. Better to suffer briefly than chronically: clean up the API conventions first, and integration becomes far easier.
Authentication choice: why Key Auth?
Considering the user mix and compatibility, we weighed JWT, HMAC, and API Key — and went with "Header-based Key Auth."
- Not JWT: requires expiry/refresh handling and client state; integration and ops cost is high.
- Not HMAC: must implement signing/timestamps and crypto; cross-language SDK maintenance is high.
- Chose Key Auth: low barrier (key carried in Header directly), high compatibility (natively supported by common tools and frameworks), and stackable security (IP whitelist, ACL, Rate Limiting).
User-call flow
Here's the actual Gateway operation steps:
- Initiate request: user calls the platform with an API Key.
- Authentication and authorization (Kong): validate the Key's validity and permissions.
- Rate limit: check whether the plan quota is exceeded.
- Service proxy: forward the request to the backend subsystem.
- Logging and response: async log write, return data.
Tiered Rate Limiting
To allocate compute resources reasonably, our traffic-shaping strategy:
- Rate Limit: separate "basic" and "high-frequency" channels for general APIs vs heavy-load services, fitting different use cases.
- Bandwidth Limit: for large file transfers, since Kong (even the paid version) doesn't natively support fine-grained "data-size-based" control, I additionally wrote a custom plugin to implement bandwidth limiting.
To support multi-node horizontal scaling, we switched the Rate Limiting policy to Redis Mode. All counters and state are stored uniformly in Redis, ensuring data consistency across nodes and avoiding errors from per-node counting.
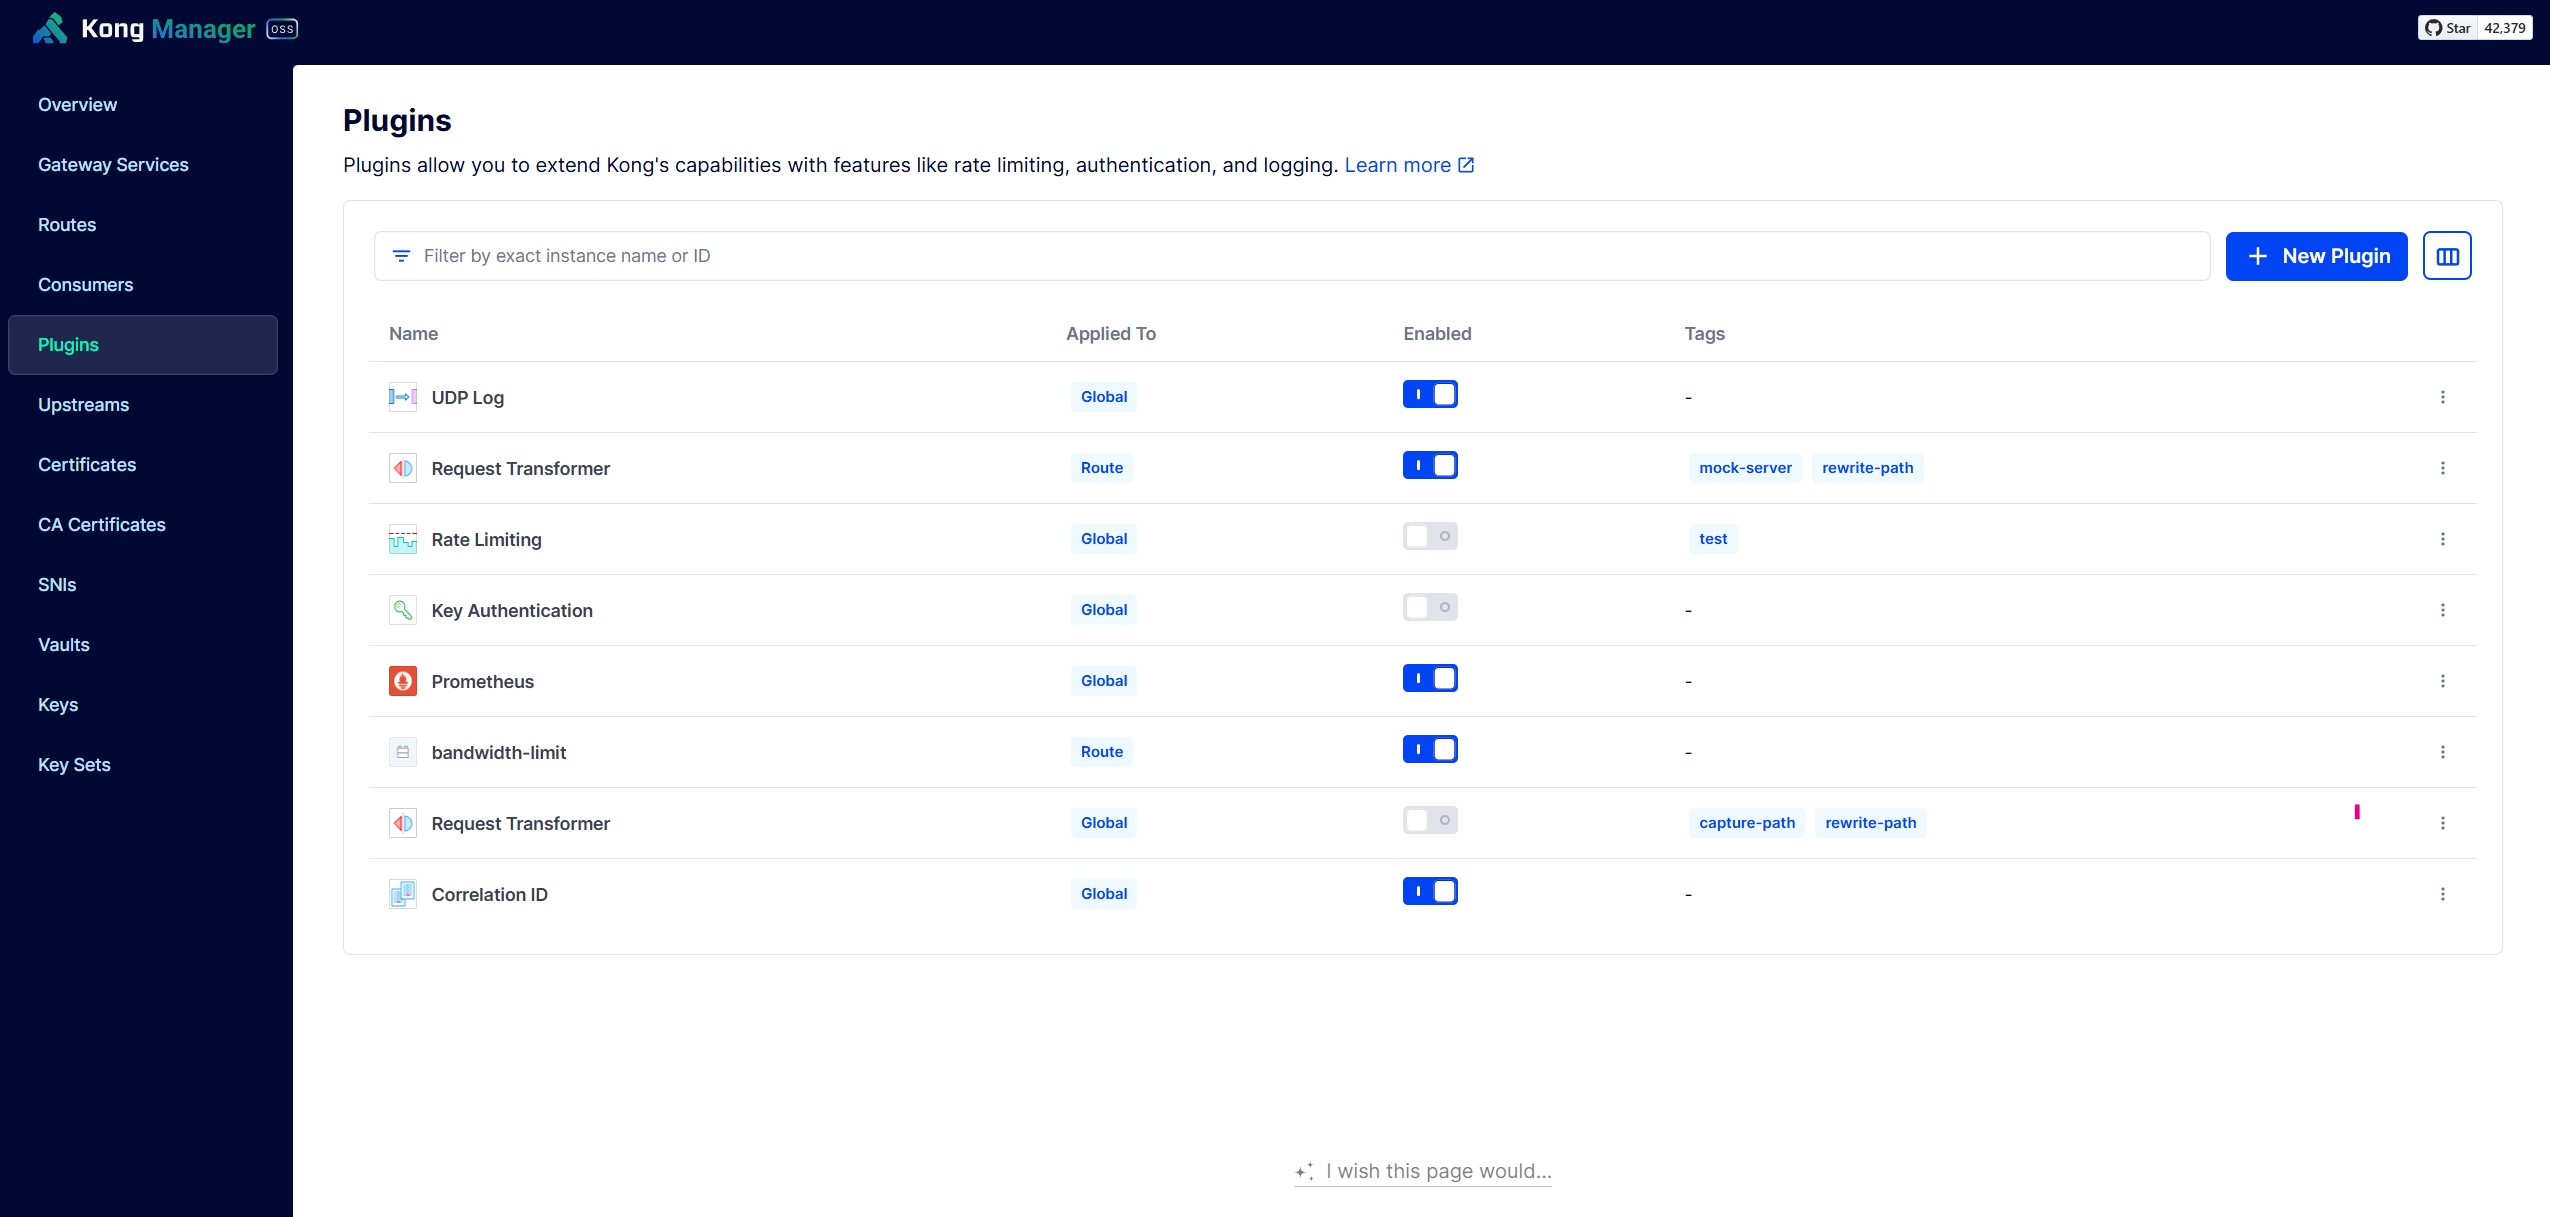
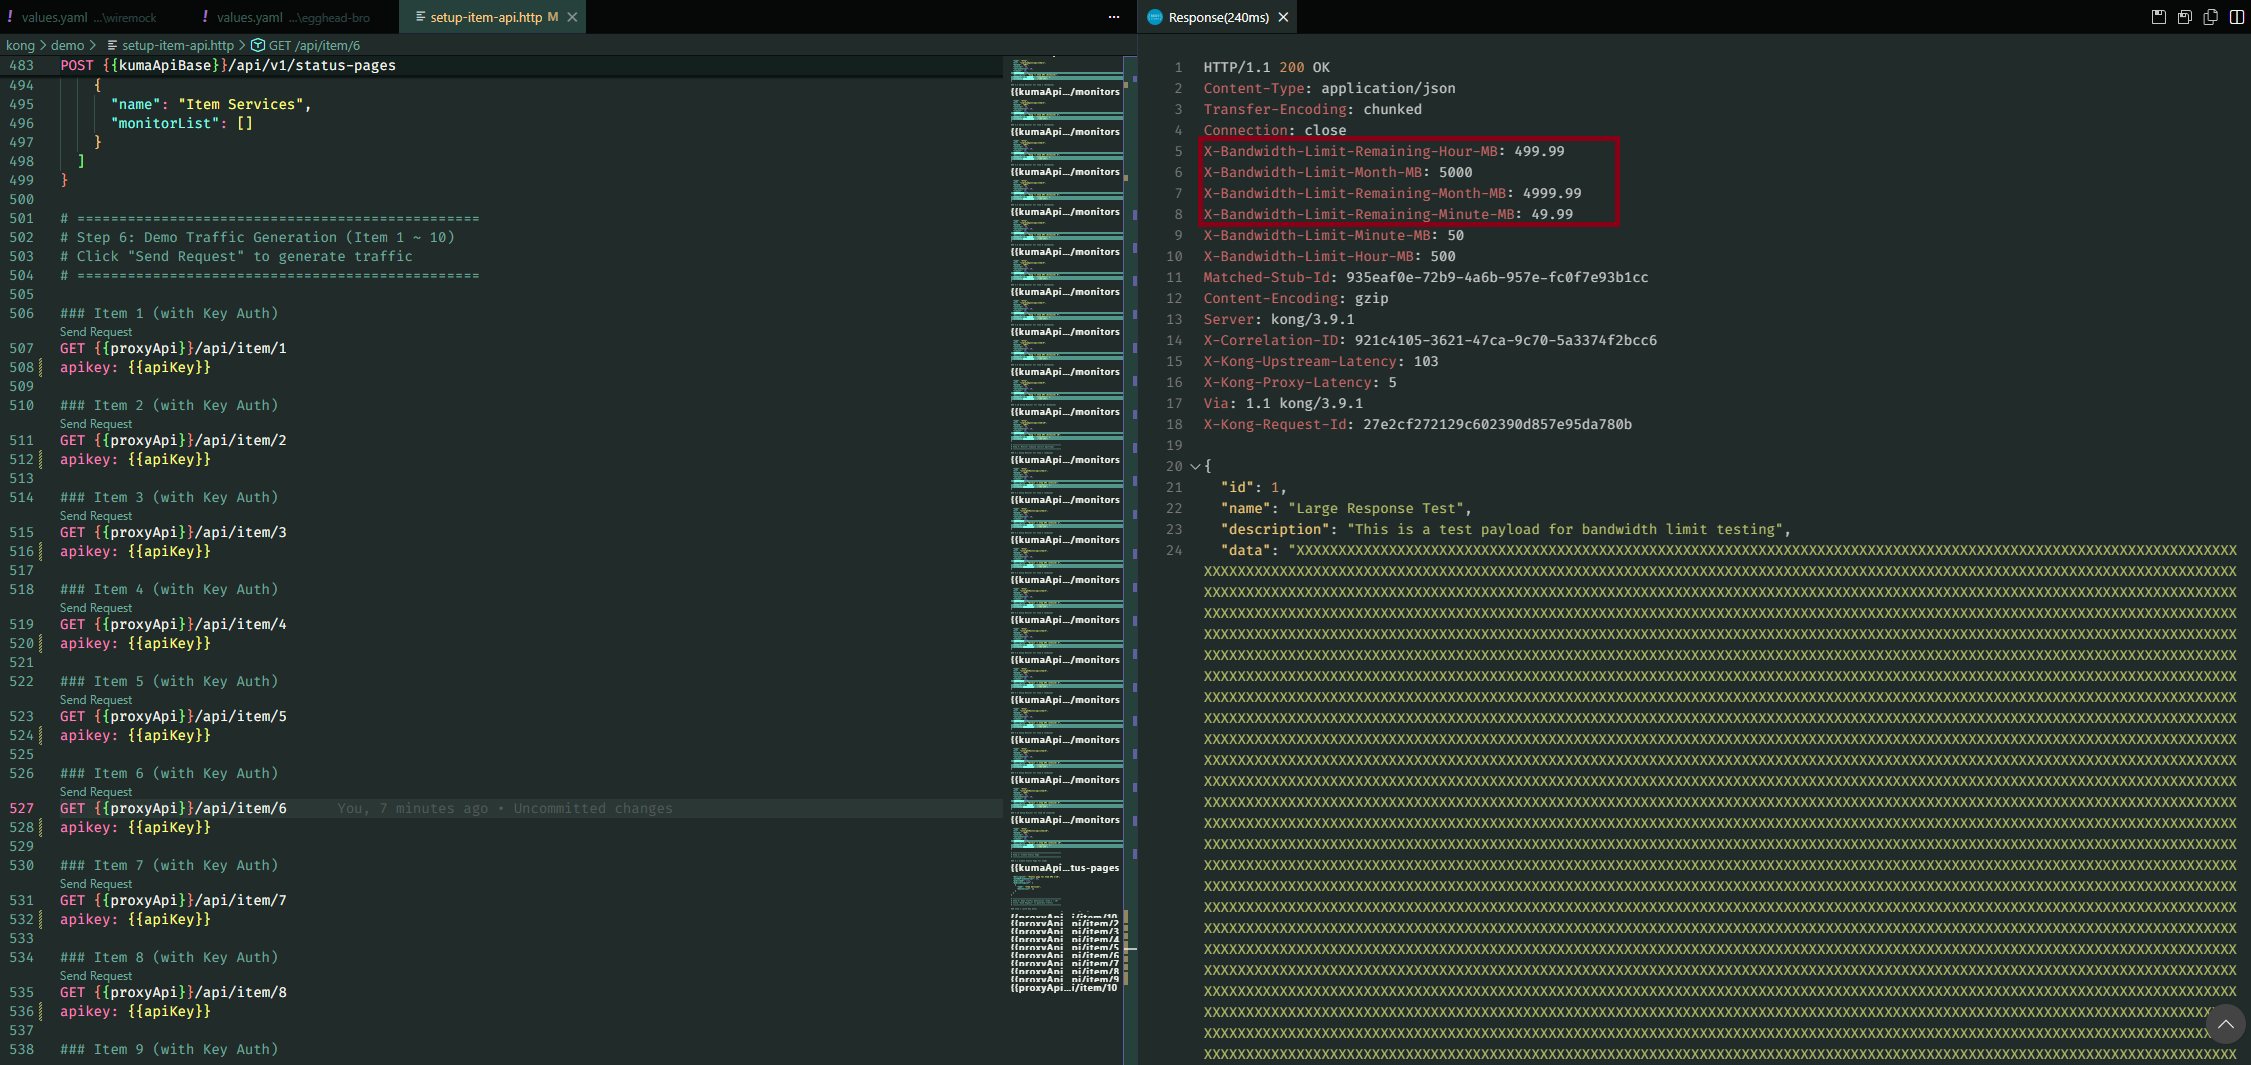
Custom Bandwidth Limiting
Beyond basic Rate Limiting, for large-file or high-bandwidth services we developed a custom Kong Lua plugin:
- Multi-dimension bandwidth control: supports six time dimensions from "second" to "year," and auto-converts MB to Bytes for precise computation.
- High-reliability architecture: implements Redis cache optimization and fault tolerance. When Redis fails, the plugin auto-degrades to a local counting strategy, preventing single point of failure from impacting API availability.
Fine-grained access control (ACL & Consumer Groups)
For paid and sensitive data, we used the ACL (Access Control Lists) plugin to build a strict permission model:
- Created Consumers like
backend_service,mobile_app. - Added Consumers to specific groups (e.g.,
business-tier-gold).
Automated onboarding (Swagger-based URL Sync)
After solving core routing and permission config, the next challenge: how to onboard many subsystems quickly and in a standardized way. To avoid manual errors from reading Swagger docs and keying configs by hand, we designed a URL Sync mechanism.
The core: "spec-as-source-of-truth, in real time." Instead of uploading files manually, the system reads the Swagger / OpenAPI Specification (OAS) URL the subsystem provides.
The automated onboarding flow has four key steps:
- Spec read (Swagger Sync): admin only needs to set the subsystem's Swagger/OAS URL, and the system auto-fetches the latest API spec.
- Kong conversion (Spec to Config): system parses the Swagger and auto-creates corresponding Routes and Plugins in Kong, ensuring Gateway routing rules match Swagger definitions exactly.
- Auto-monitoring: at onboarding time, the system auto-triggers Uptime Kuma to set up a Health Check, achieving "monitor as soon as the service is live."
- External publishing: after the above config, the service is officially live and proxied through the Gateway.
3. Building comprehensive observability
Solid monitoring is the bedrock of stable Gateway operation. This half-year we invested heavily in integrating the ELK Stack and Prometheus ecosystems, achieving full observability from "log query" to "metric dashboards."
Log analysis (ELK Stack & Custom Lua)
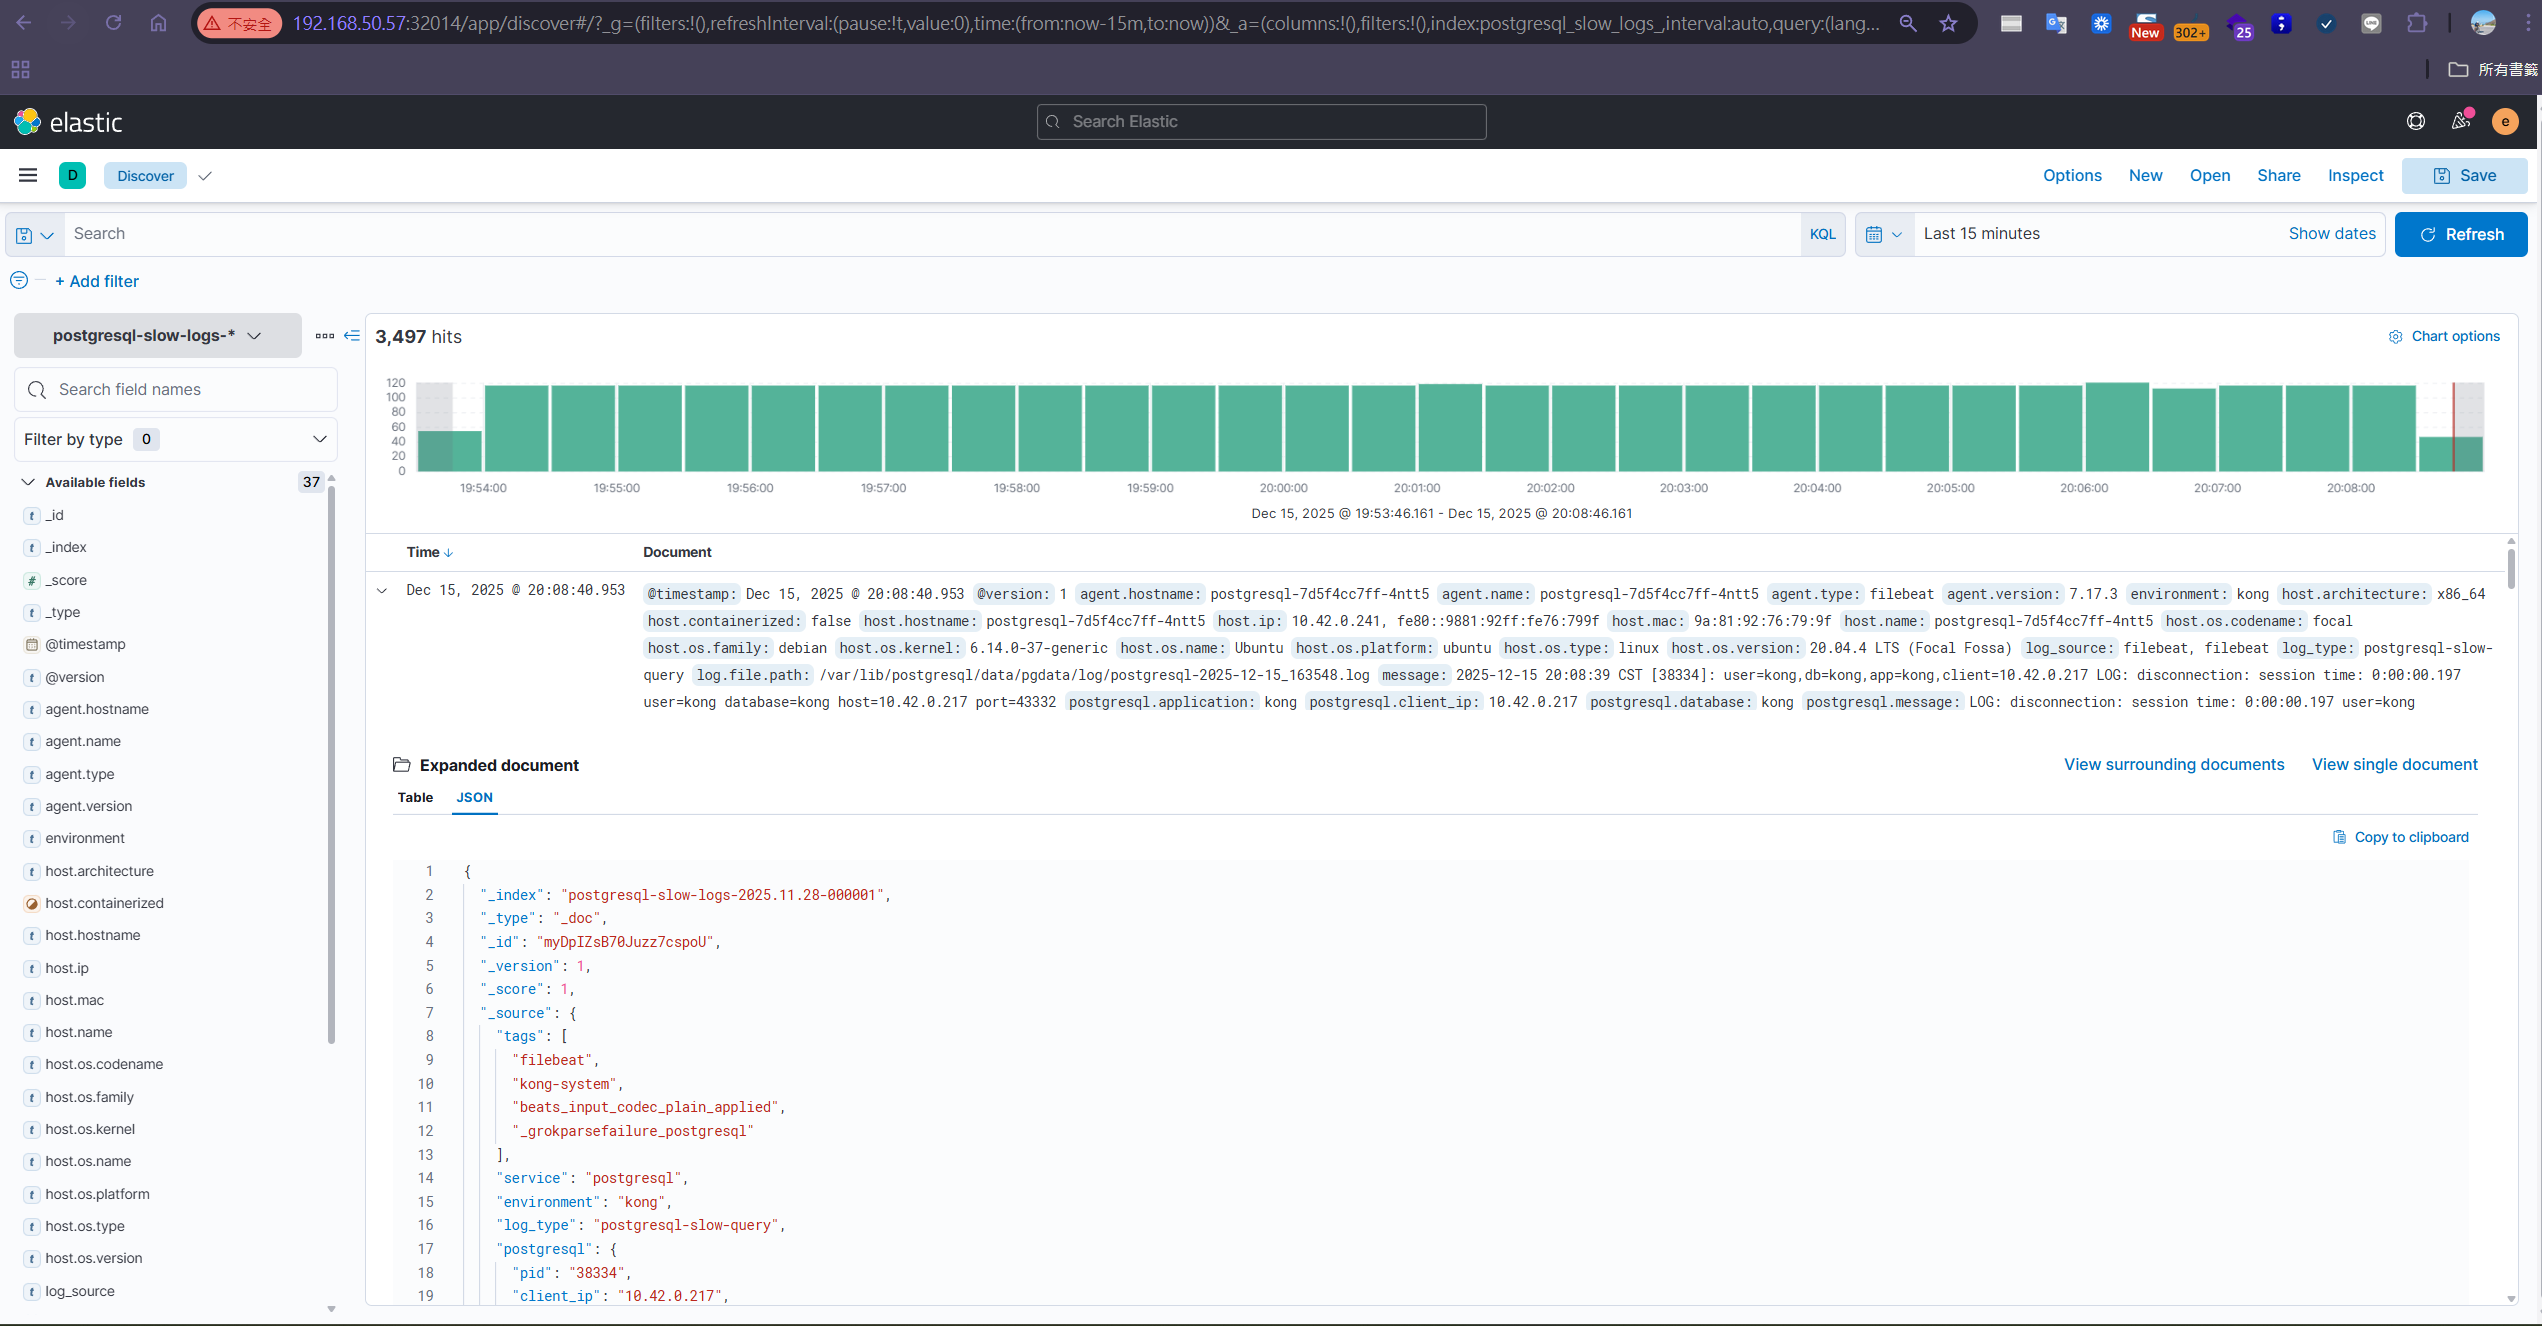
Kong's logging plugin already includes a client_ip field, but to get more advanced info (like the original IP after multiple proxy layers, the X-Forwarded-For Header, etc.), you can use the UDP Log plugin's custom_fields_by_lua to inject custom fields:
custom_fields_by_lua = {
  remote_addr = "return kong.client.get_forwarded_ip()",
  real_ip = "return ngx.var.realip_remote_addr",
  x_forwarded_for = "return kong.request.get_header('x-forwarded-for')"
}
This config gives us more complete source-IP info for precise traffic-source and behavior analysis — providing key data for business decisions. We also deployed Filebeat in Sidecar mode, reading access/error logs from /var/log/kong and forwarding them to Elasticsearch, building kong-logs-YYYY.MM.DD indexes.
Metrics monitoring (Prometheus & Grafana)
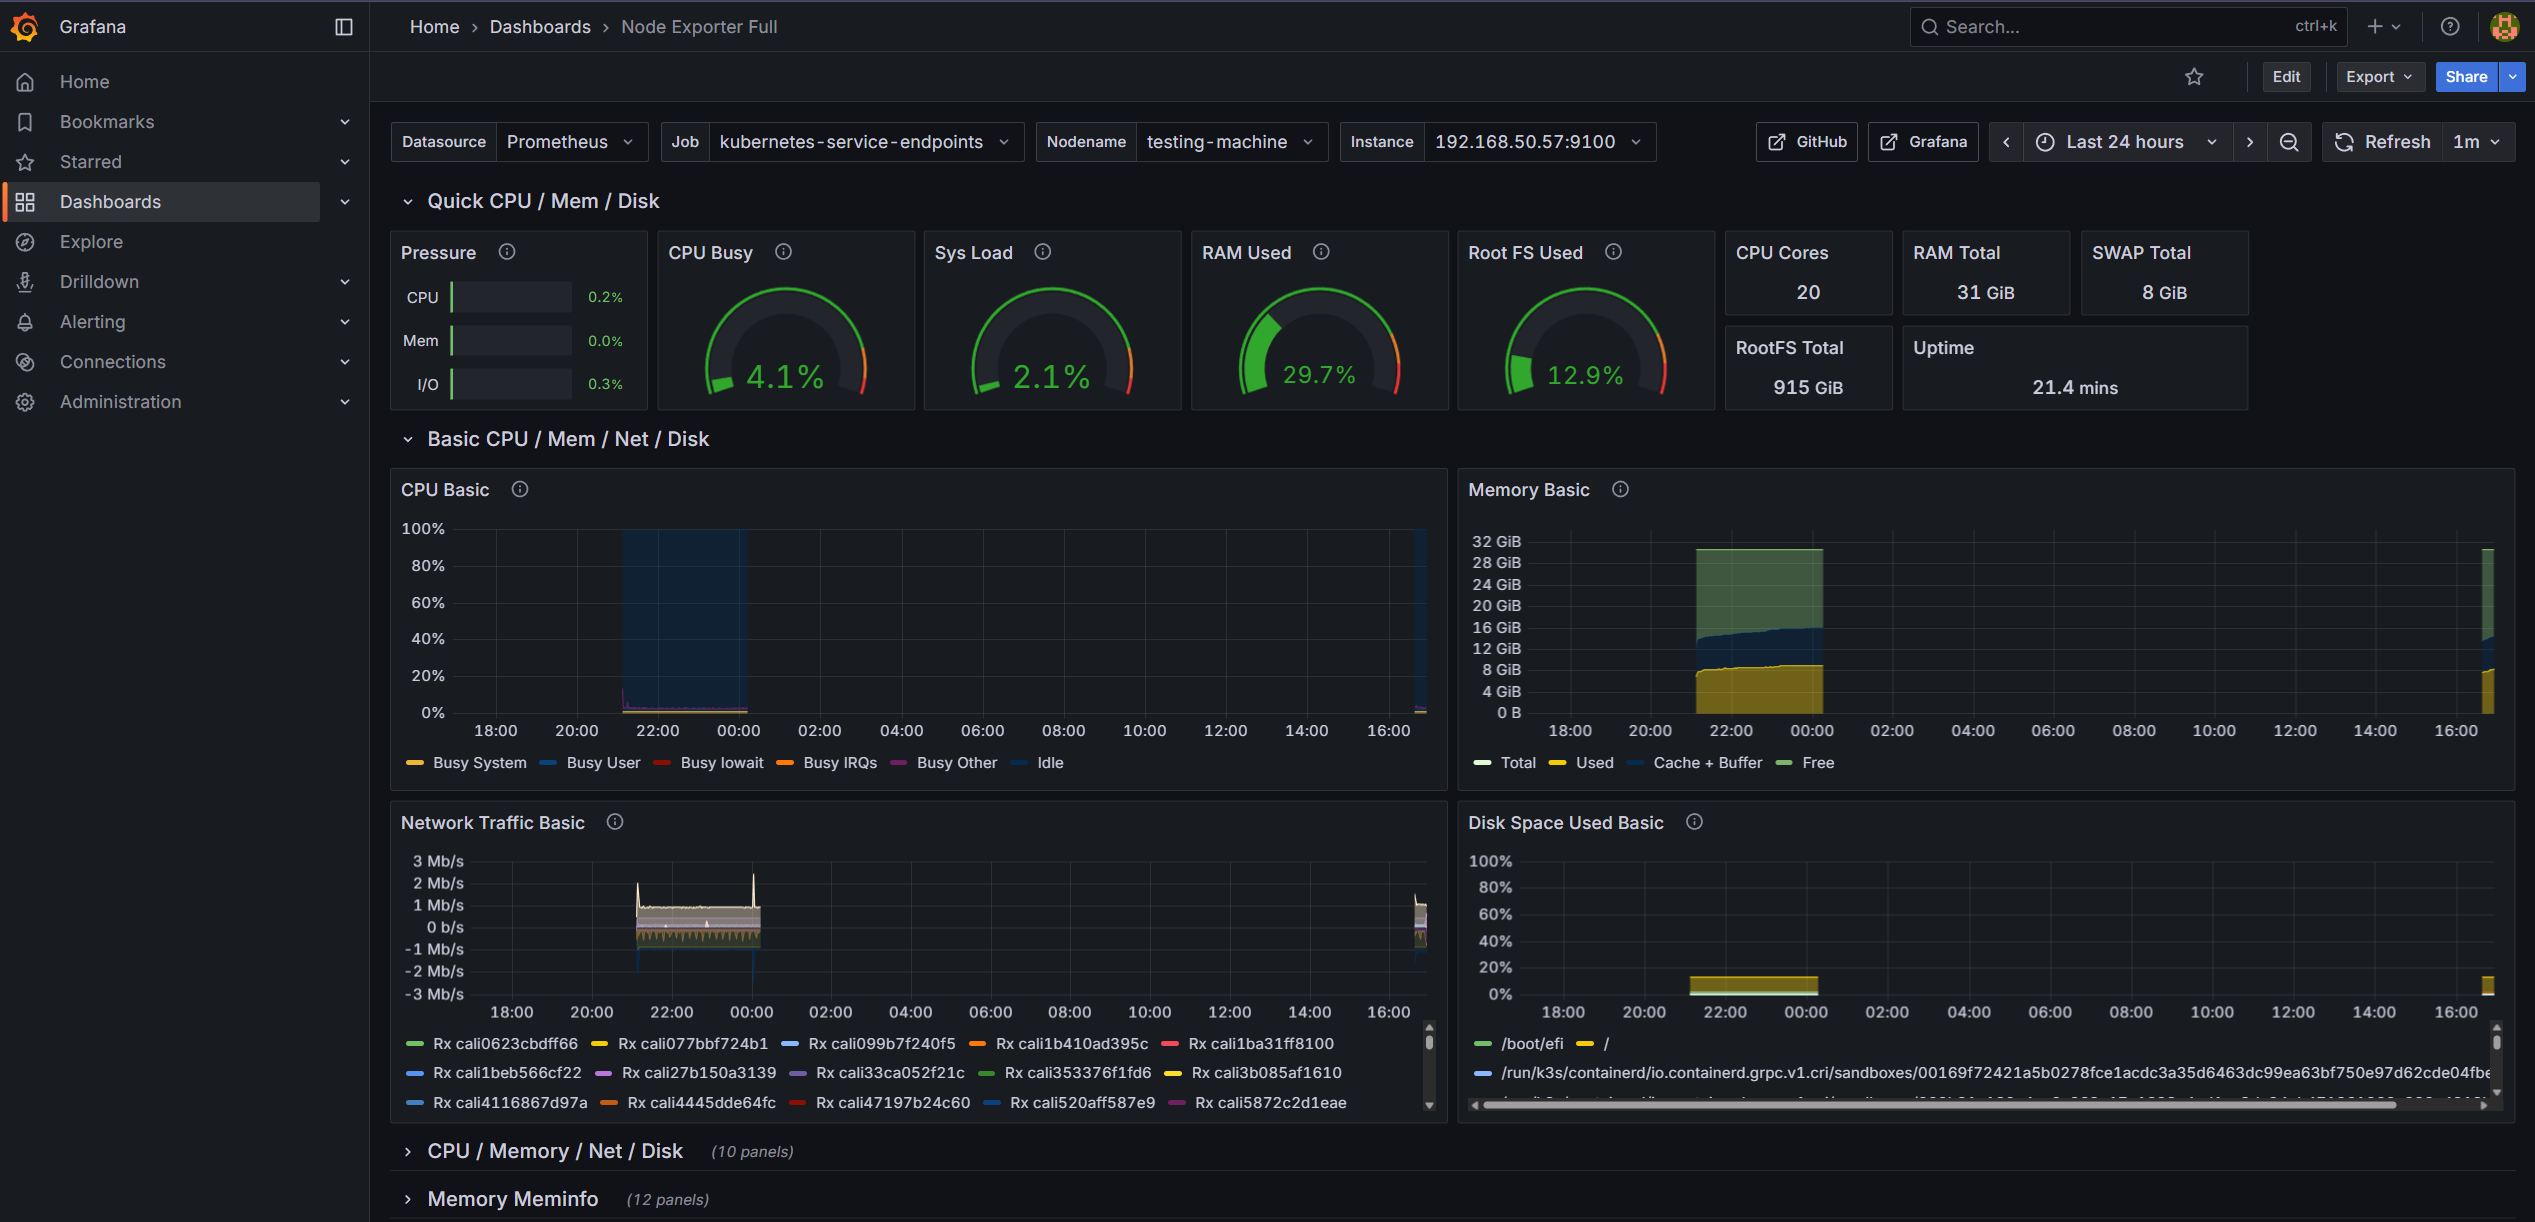
With Kong's Prometheus plugin, we collected detailed traffic metrics and built dedicated dashboards in Grafana:
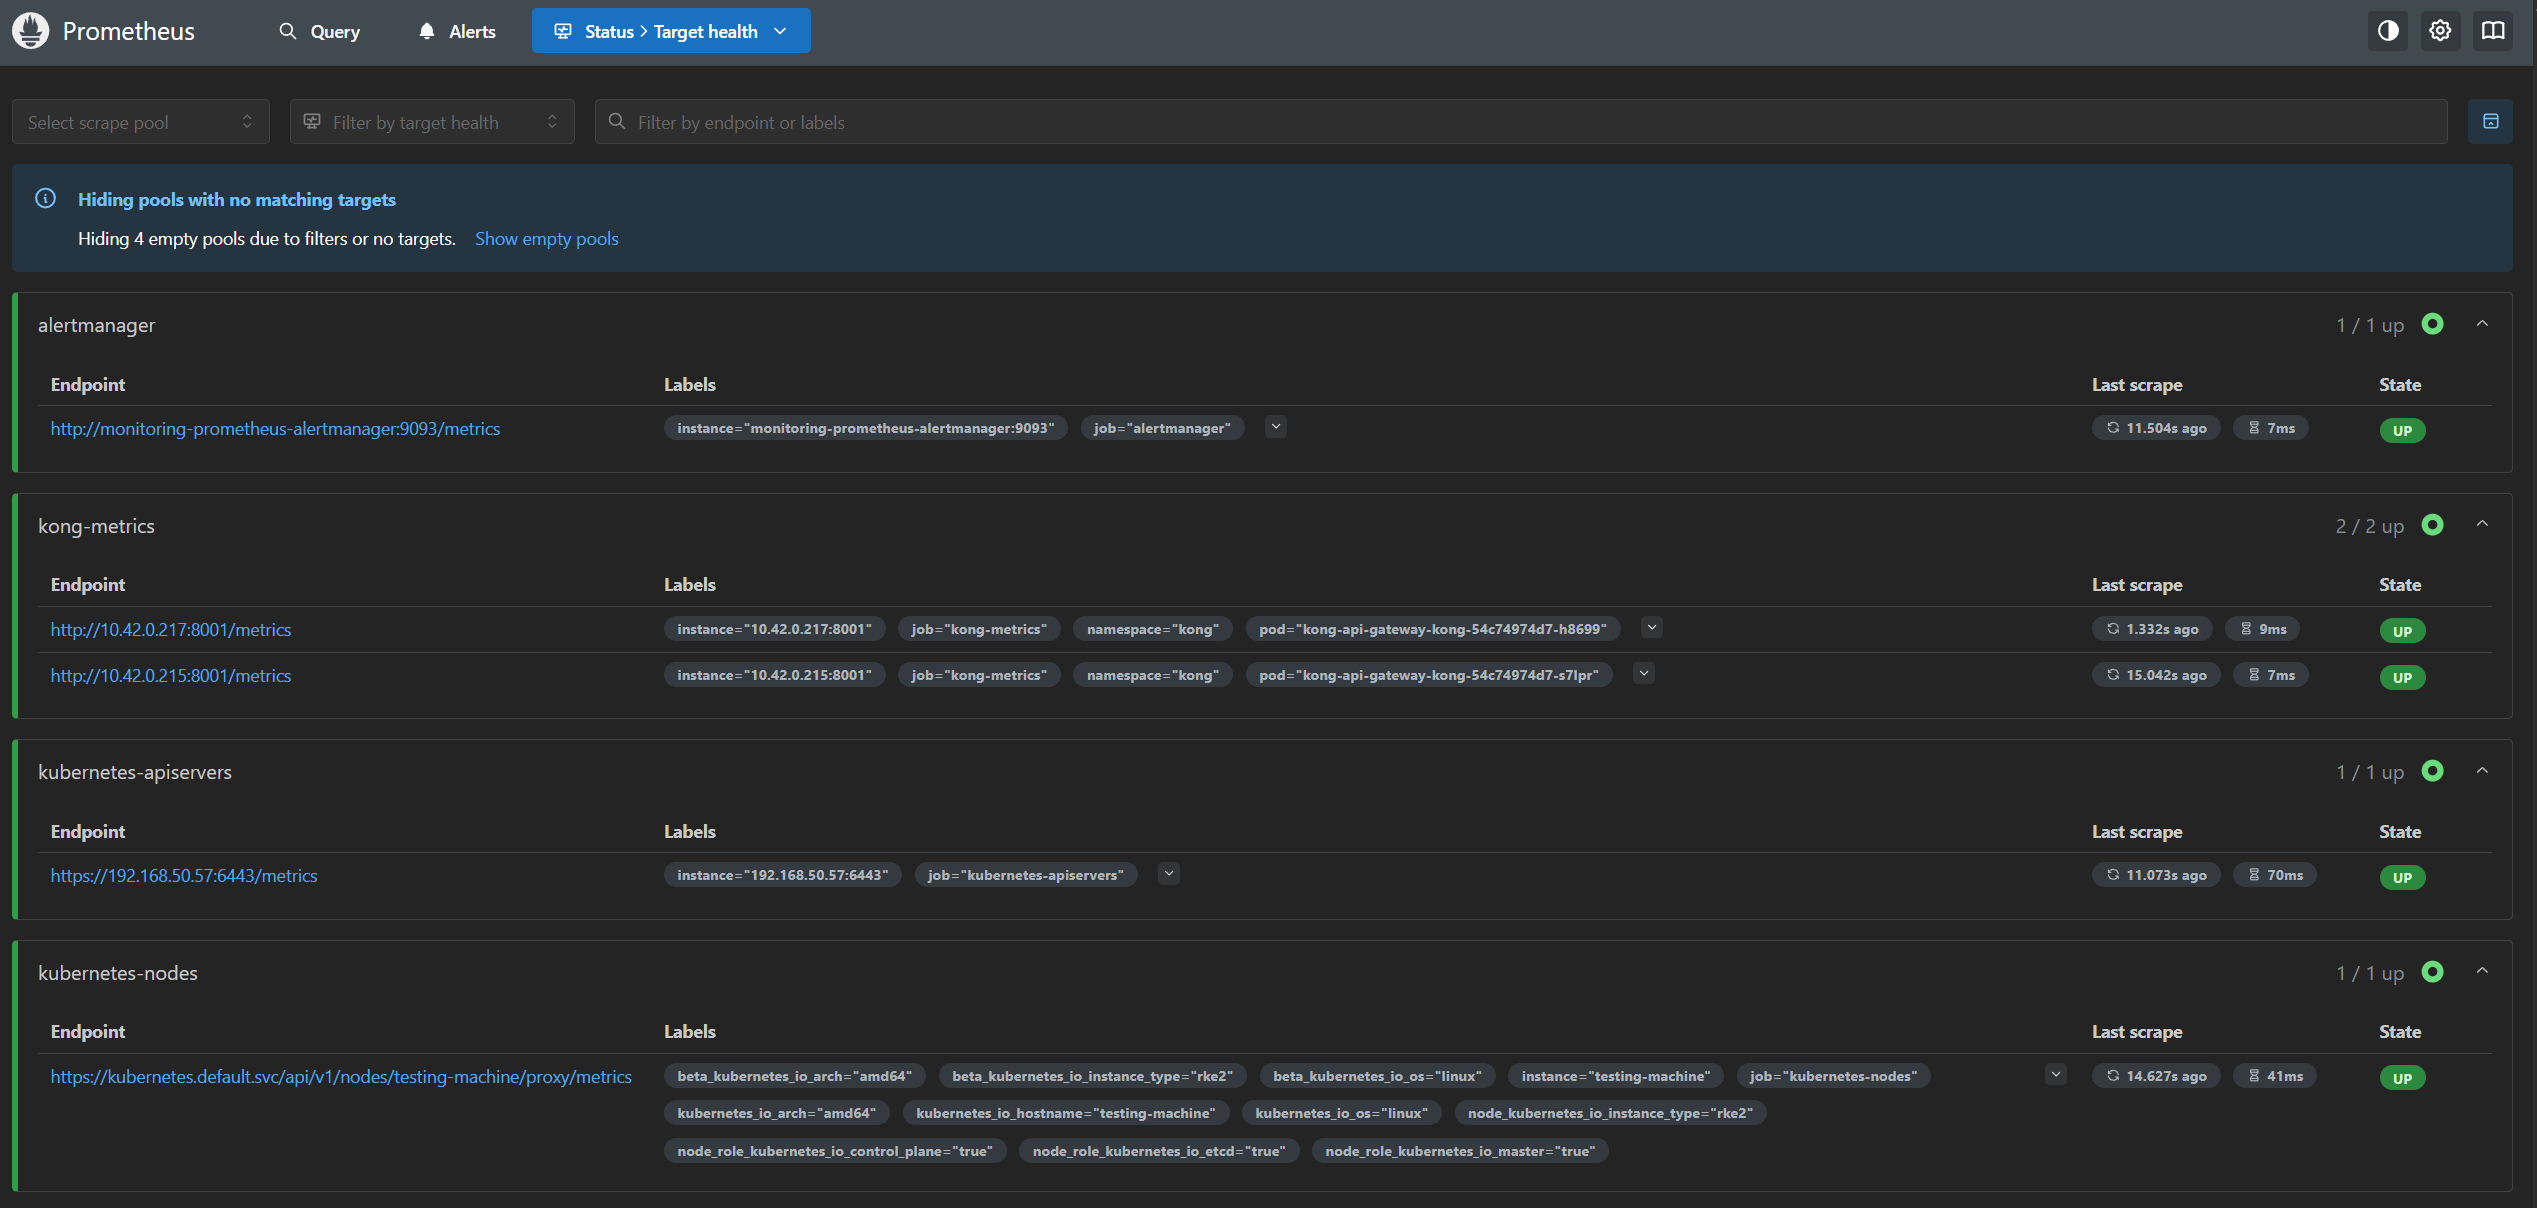
- Kong API Gateway Dashboard: real-time display of Request Rate, Latency, Bandwidth, etc.
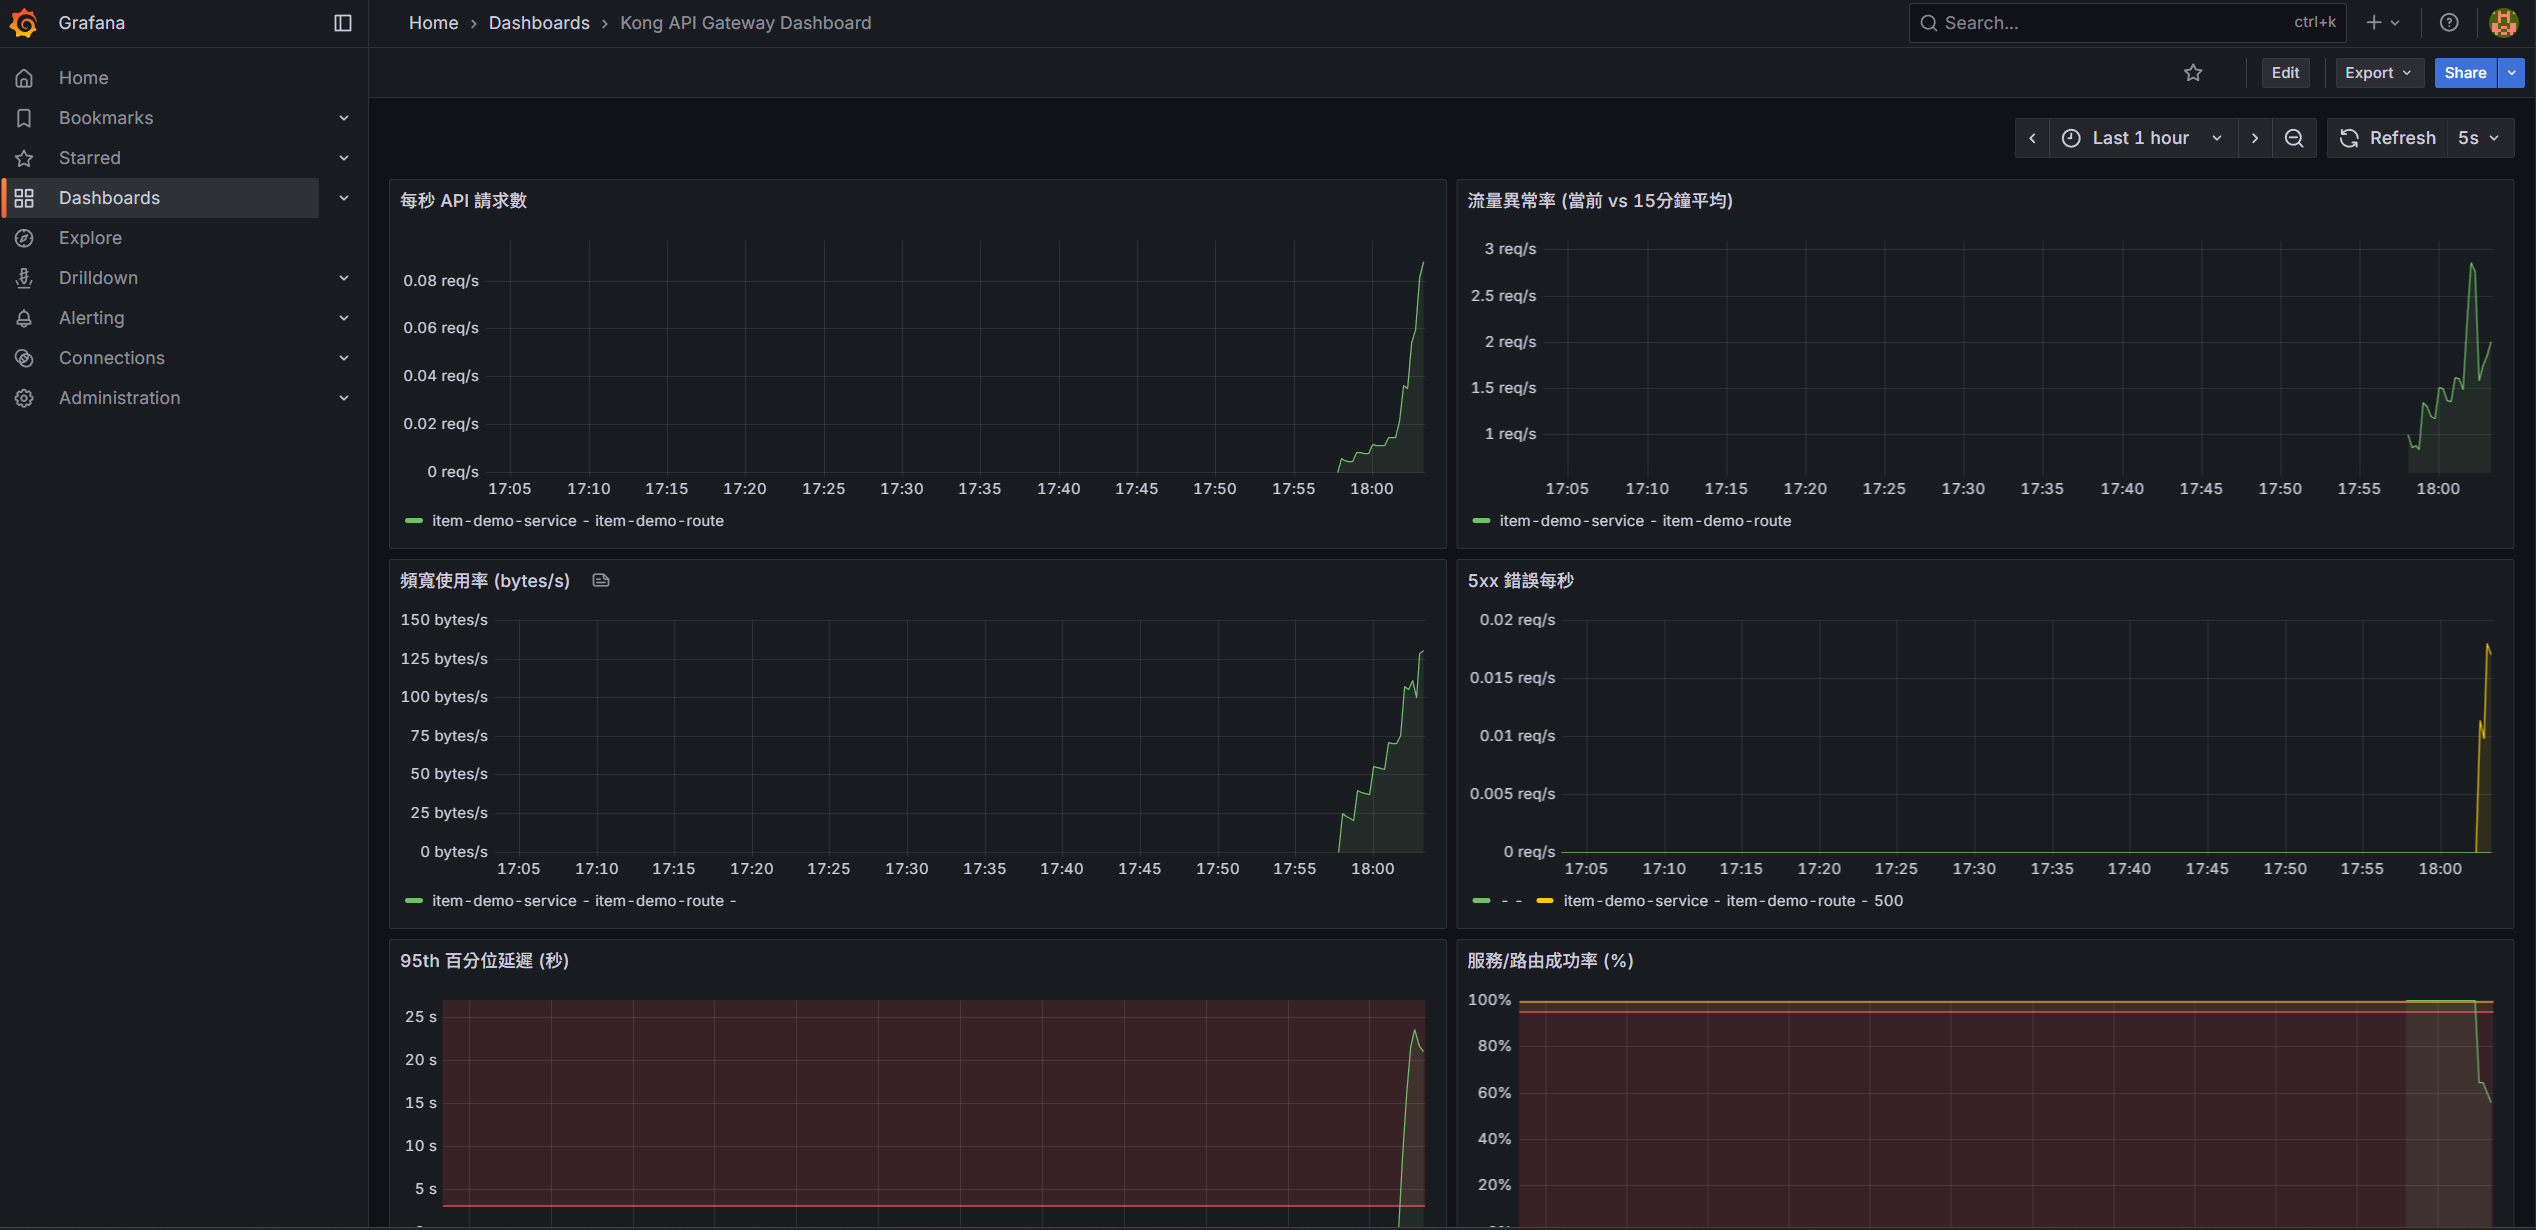
- Kubernetes Node hardware monitoring: via Node Exporter integration, view each K8s node's hardware status (CPU, memory, Disk I/O, Network Traffic) directly in Grafana — easy to grasp infrastructure health.
Service availability monitoring (Uptime Kuma Clustering)
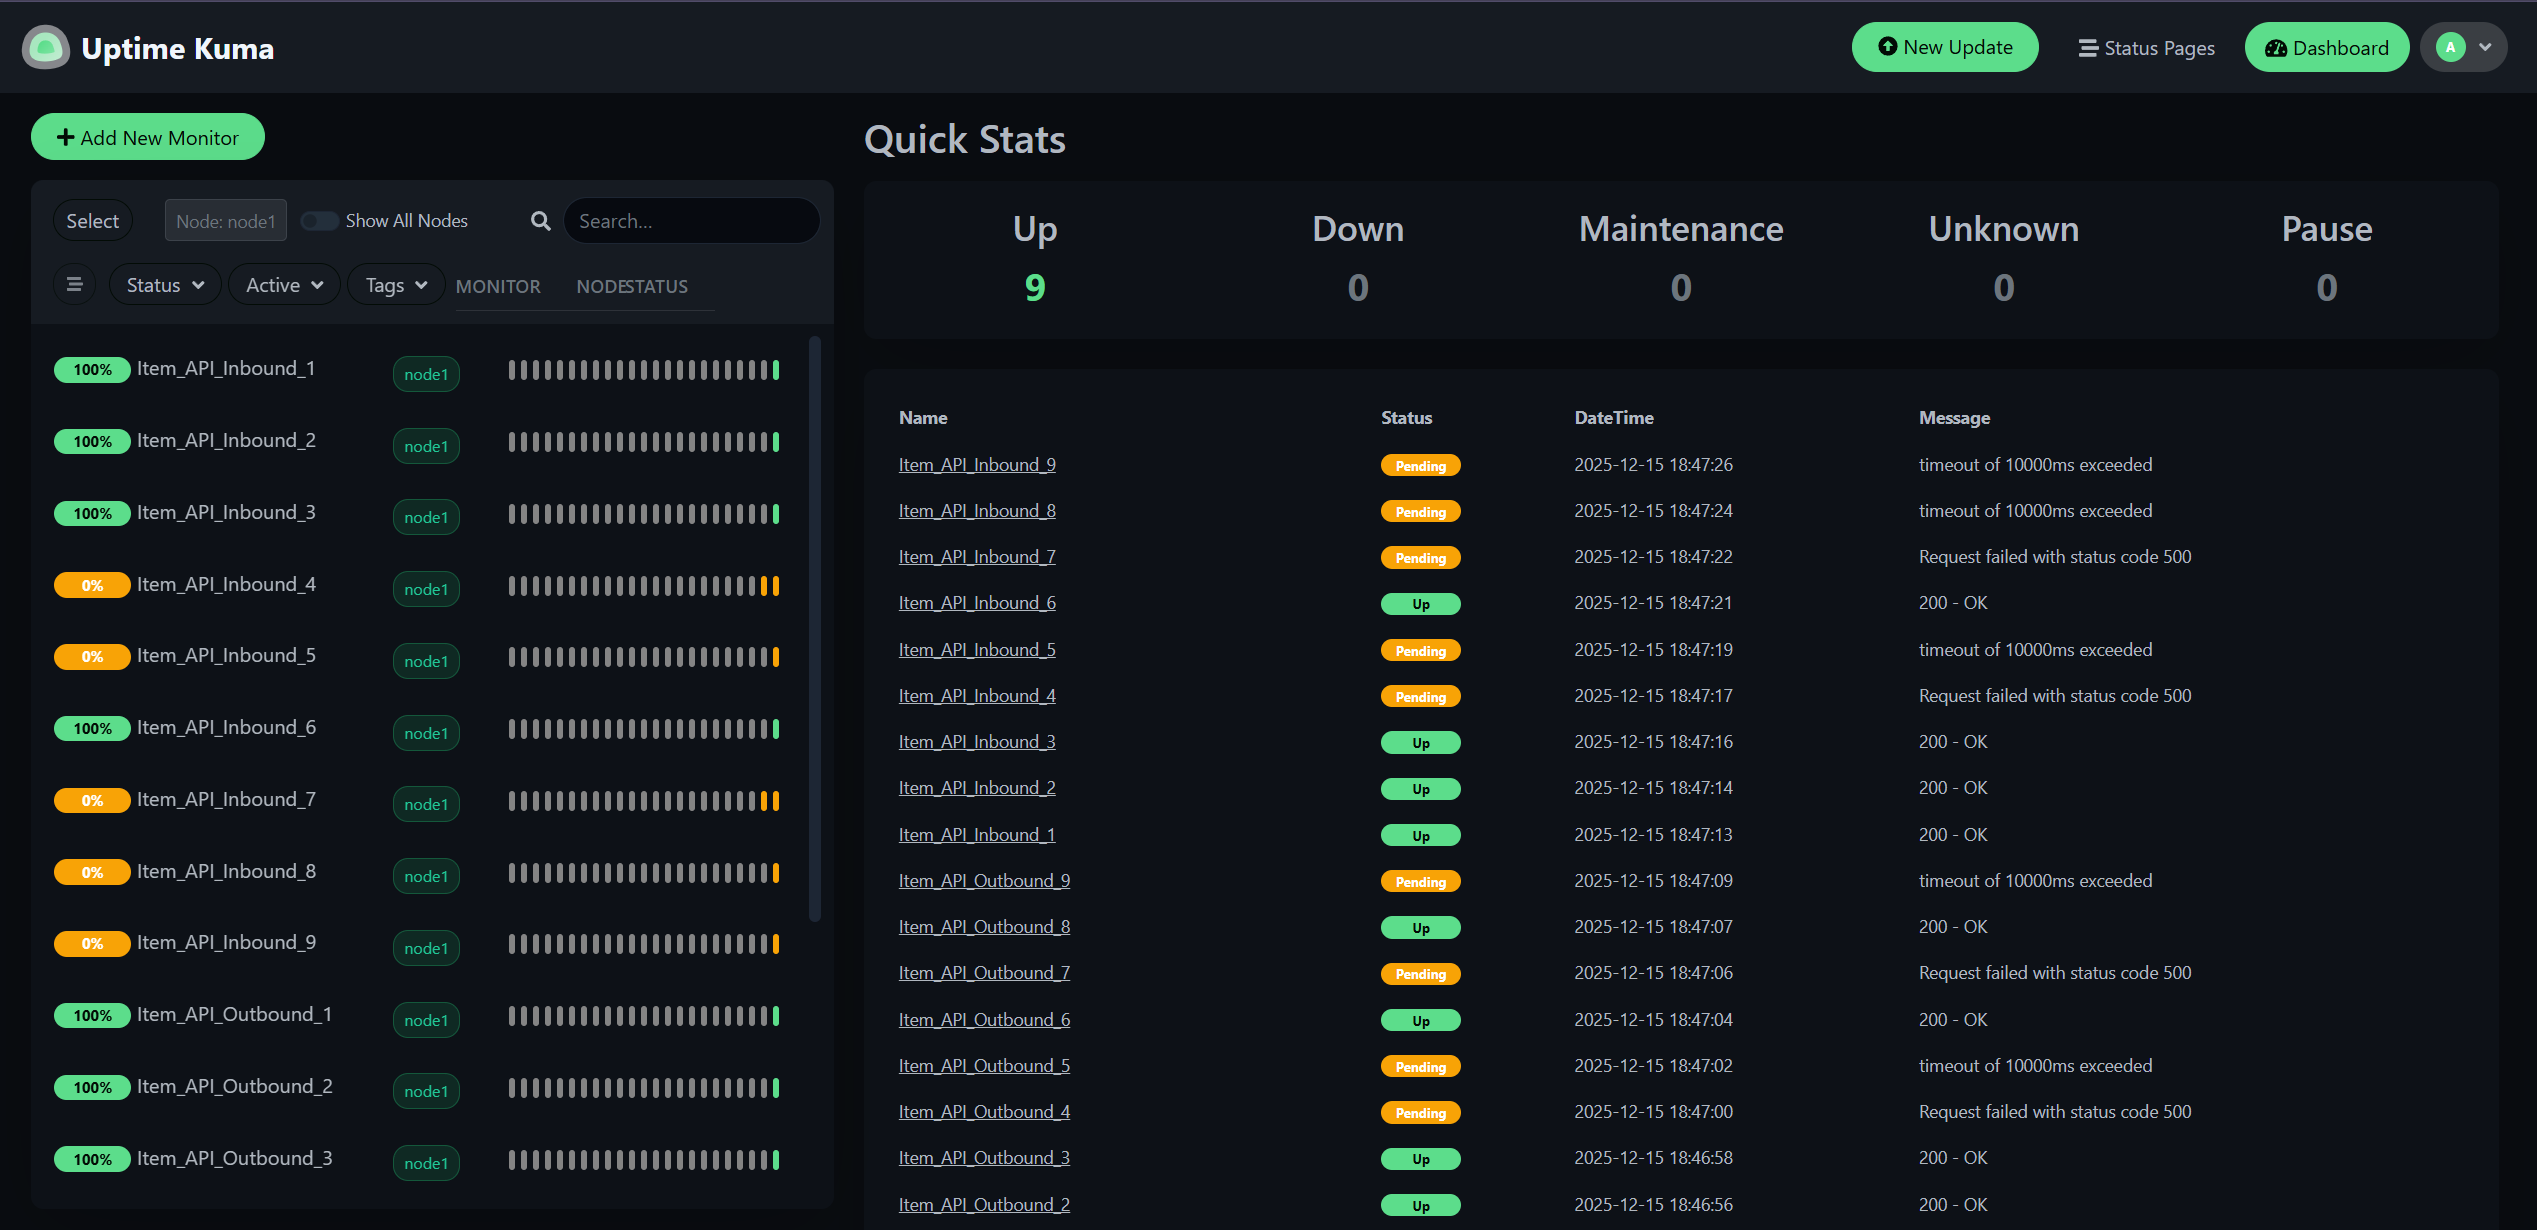
Uptime Kuma is an open-source self-hosted monitoring tool similar to Uptime Robot, but you can deploy it entirely on your own server. It provides an intuitive Web UI, supports multiple monitor types (HTTP, TCP, Ping, DNS, etc.), and can send alerts via Telegram, Slack, Email. For teams that need to monitor lots of internal services without depending on external SaaS, it's a great choice.
To overcome native Uptime Kuma's performance bottleneck under heavy monitoring load (around 800 APIs), we restructured the architecture:
- Automated extension (RESTful API Extension): native Uptime Kuma lacks an external API, so to achieve "monitor as soon as service is live" automation, we extended a RESTful API ourselves so that future API onboarding triggers monitoring automatically.
- Database extracted: replaced the default SQLite with MariaDB, deployed independently as
kuma-mariadbservice, supporting higher concurrent reads/writes. - Clustering: multiple Uptime Kuma instances connect to the same database for load distribution.
I wrote up the implementation details in another article: Building a Uptime Kuma Cluster System with Vibe Coding: from Single-Node to High-Availability Monitoring Platform.
4. Setting up alerting
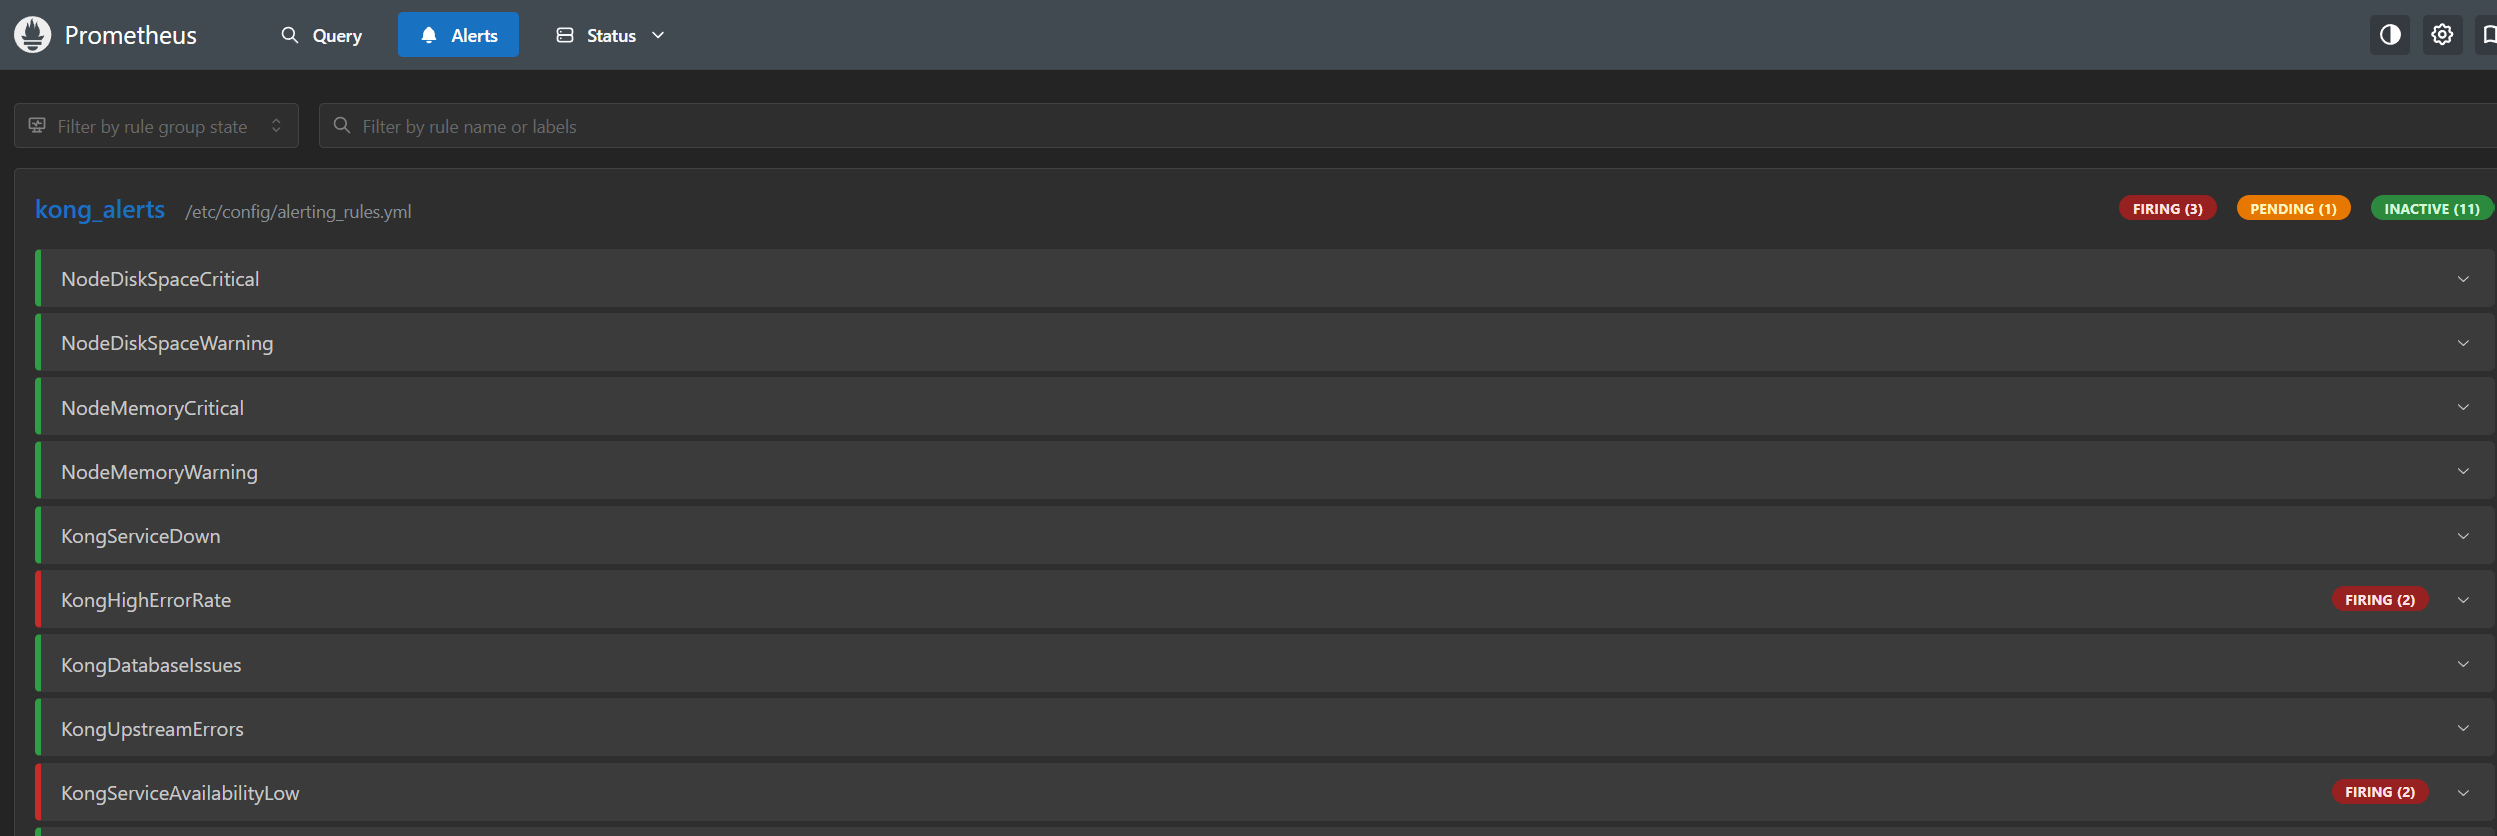
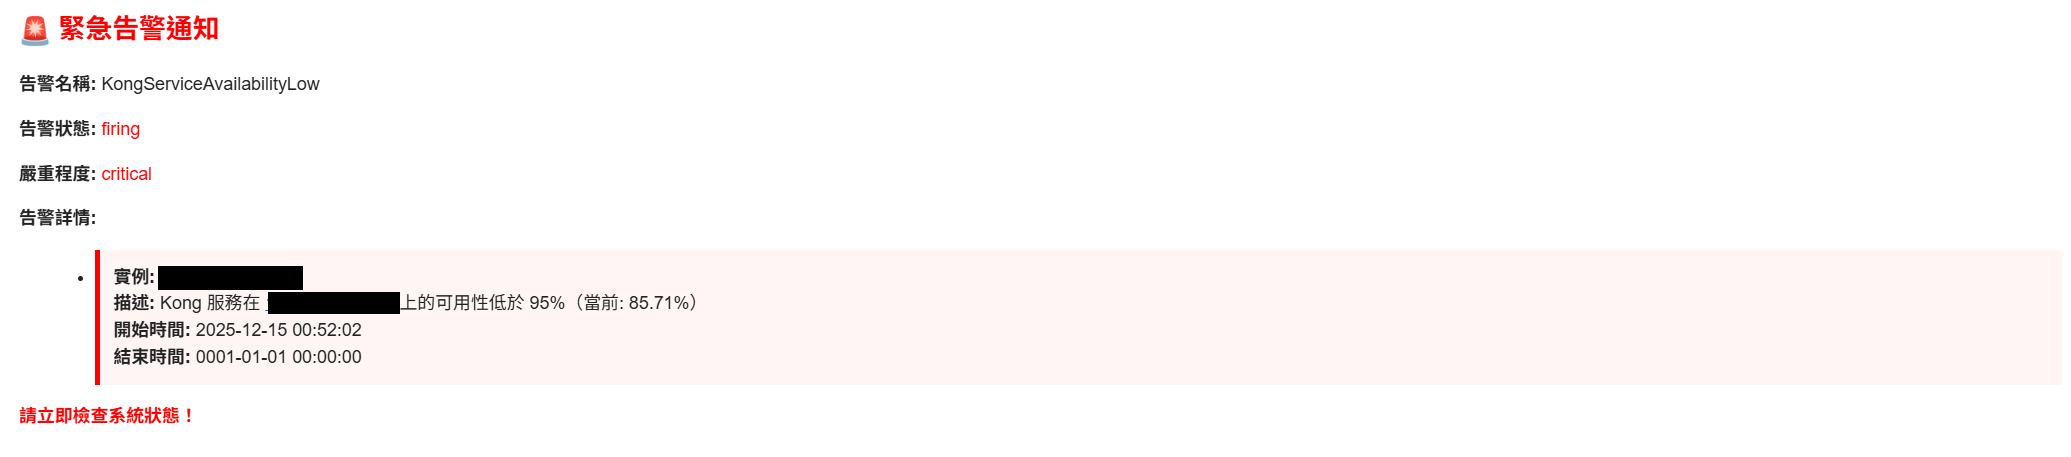
The last mile of monitoring is "alerting." We defined 20 alert rules in Prometheus and Alert Manager, split into Critical, Warning, and Info severities.
Here are several key Critical alert rules (PromQL):
1. Service completely unavailable (KongServiceDown)
Triggers when the Kong namespace has no Up Pods:
sum(up{job="kong-metrics", namespace="kong"}) == 0
2. High error rate (KongHighErrorRate)
Triggers when 5xx error rate exceeds 5% — usually indicating backend service issues:
(sum(rate(kong_http_requests_total{code=~"5.."}[5m])) by (instance)
 /
 sum(rate(kong_http_requests_total[5m])) by (instance)
) > 0.05
3. High latency (KongHighLatency)
Triggers when P95 request latency exceeds 2 seconds (Warning level):
histogram_quantile(0.95,
  sum(rate(kong_latency_bucket[5m])) by (le, instance)
) > 2000
4. System resource alerts
- Disk space:
NodeDiskSpaceCritical(free space < 5%) - Memory:
NodeMemoryCritical(usage > 95%)
5. Validation and outcomes
The final outcome of these six months: successfully helping the project pass the first-phase system acceptance.
During acceptance, we used the open-source API testing tool Hoppscotch (formerly Postwoman) for intensive functional validation against multiple critical services. Test results showed the API Gateway not only effectively intercepts unauthorized malicious requests, but its fine-grained traffic-control mechanism also kept services stable under high system load — meeting all the performance metrics specified in the contract.
6. Reflections
Kong OSS itself doesn't provide group rules, advanced traffic control, or route-level-only control mechanisms, and there's no native concept of API subscription. So if you want to use Kong to implement API subscription tiers or more complex group permissions and traffic rules, you typically need a lot of customization. Otherwise, the design easily ends up not matching needs and you have to bend to the existing architecture and logic.


Comments