
Introduction
In Kubernetes, Metrics Server is an important component that provides real-time metric data on cluster resource usage. These metrics are crucial for managing and scaling the resource usage of Pods and nodes. This article will introduce how to install, configure, and view data from the Metrics Server.
Kubernetes Has Two Main Types of Metrics
- Core metrics: Data is collected from Kubelet and cAdvisor, then provided by the metrics-server to the Horizontal Pod Autoscaler (HPA) and other services for use.
- Custom Metrics: Data metrics collected by Prometheus.
1. Install Metrics Server
First, we need to install Metrics Server. Its installation and configuration are very simple and can be deployed directly via a Kubernetes YAML file. Run the following command to download and apply the latest version of the Metrics Server deployment configuration:
kubectl apply -f https://github.com/kubernetes-sigs/metrics-server/releases/latest/download/components.yaml
This will automatically download the latest metrics-server configuration from GitHub and deploy it to your Kubernetes cluster.
2. Configure the Default Editor to vim
In Kubernetes, certain commands (like kubectl edit) use the default editor for editing. If you're used to using vim, you can set the KUBE_EDITOR environment variable to change the default editor. Run the following command to set it:
export KUBE_EDITOR=vim
This way, every time you execute the kubectl edit command, the system will automatically launch vim for editing.
3. Check the Metrics Server's Running Status
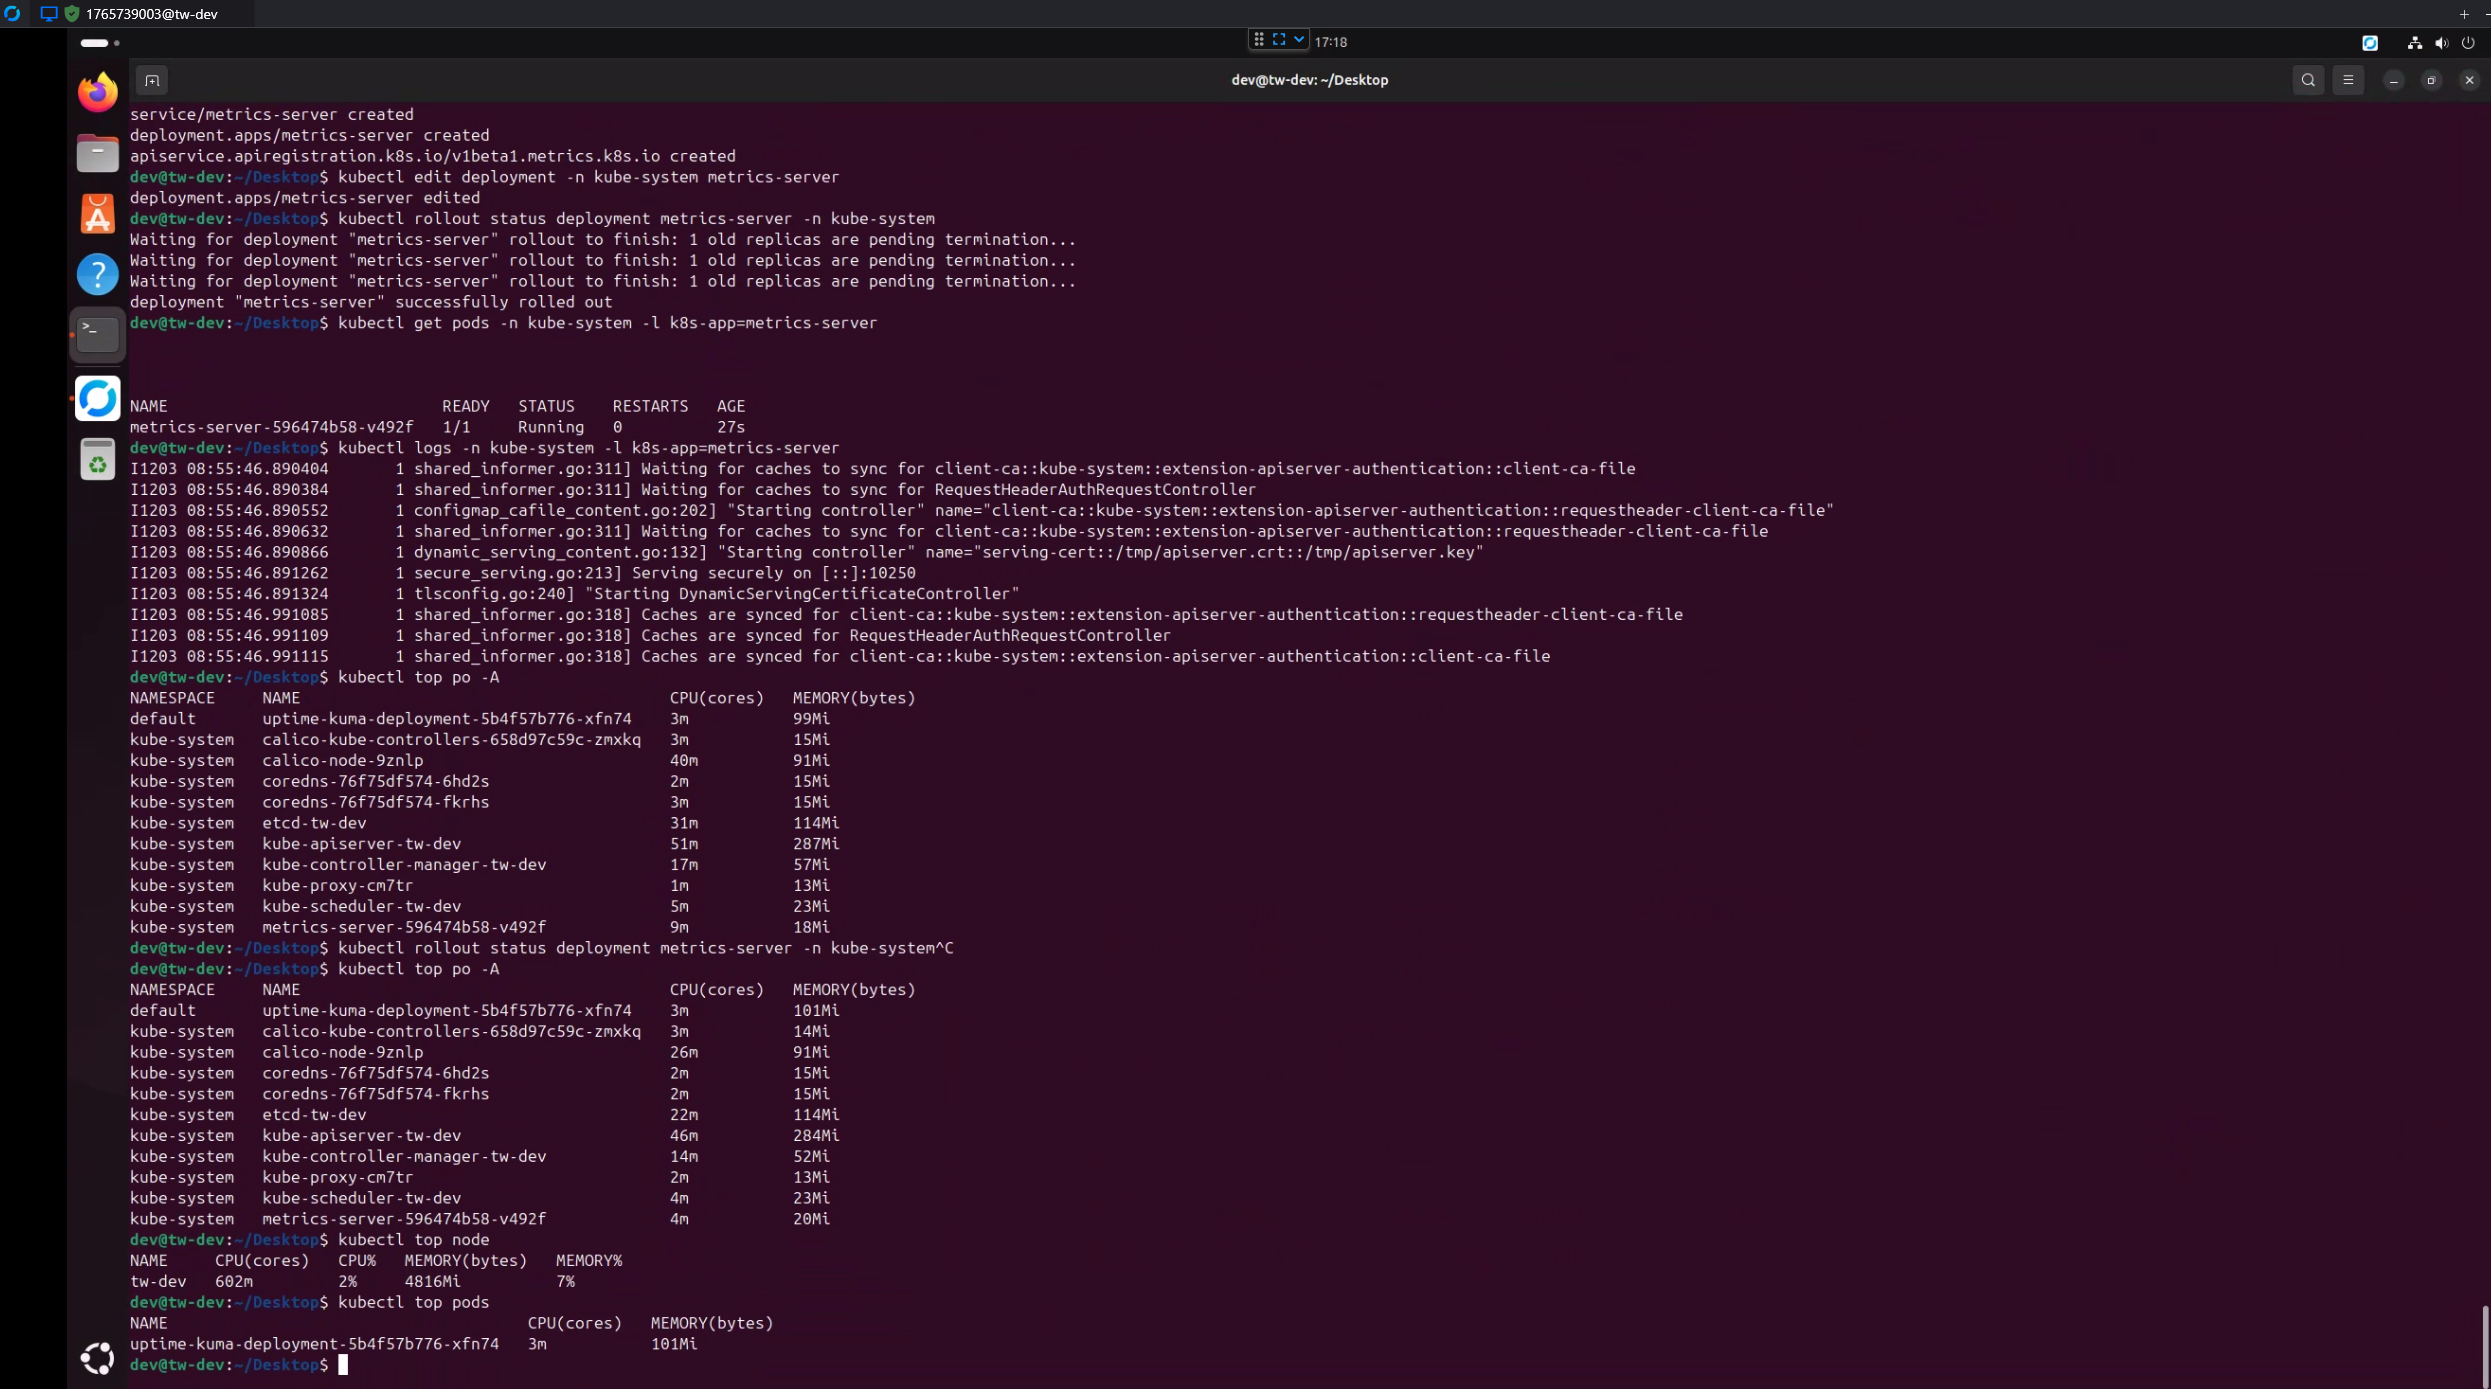
After installing and deploying Metrics Server, you can check its running status with the following commands:
View the Metrics Server Logs:
kubectl logs -n kube-system -l k8s-app=metrics-server
This will display the logs for metrics-server, allowing you to check if it has started successfully and is running correctly.
View Cluster Resource Usage:
kubectl top po -A
This command displays the resource usage of Pods in all namespaces, including CPU and memory consumption. This helps you understand the overall resource consumption of the cluster.
4. Modify the Metrics Server Configuration
Sometimes, you may need to modify the configuration of metrics-server, for example, to adjust resource limits or change other parameters. You can use the following command to edit the Metrics Server's Deployment:
kubectl edit deployment -n kube-system metrics-server
This will open an editor where you can modify the YAML configuration as needed.
In the args section, add a line
- --kubelet-insecure-tls
to add the setting for certificate checking.
spec:
  containers:
  - args:
    - --cert-dir=/tmp
    - --secure-port=4443
    - --kubelet-insecure-tls
    - --kubelet-preferred-address-types=InternalIP,ExternalIP,Hostname
    - --kubelet-use-node-status-port
    image: k8s.gcr.io/metrics-server/metrics-server:v0.4.1
    imagePullPolicy: IfNotPresent
After updating, restart metrics and confirm the deployment status
Use the following command to ensure the changes have been applied and there are no errors.
kubectl rollout status deployment metrics-server -n kube-system
This will display the rolling update status of metrics-server. When all Pods have been successfully updated, it will show "deployment "metrics-server" successfully rolled out".
Check the metrics-server status
kubectl get pods -n kube-system -l k8s-app=metrics-server
Test
kubectl top get nodes
kubectl top get pods
Conclusion
Metrics Server is a very useful component in Kubernetes that can help you better manage resource usage within your cluster. Through this article, you have learned how to install, configure, and use the Metrics Server, as well as how to view and modify its deployment configuration. Hopefully, these steps will help you manage resources in your Kubernetes cluster more efficiently.


Comments