


前言
Prometheus 和 Grafana 是 Kubernetes 生態系統中的常見組合,這篇文章將展示如何使用 Prometheus 監控 Nginx 請求,並利用 Grafana 進行數據可視化。
了解 Nginx 的 stub_status
在啟動 Prometheus 容器應用前,讓我們先了解 Nginx 的 stub_status 模組,它提供了關於 Nginx 運行狀態的基本指標,Prometheus 主要是透過,stub_status 獲取 nginx 上的資訊。
設定 Dockerfile
首先,創建一個 Dockerfile,基於 Nginx 映像檔進行自訂設定:
FROM nginx
COPY nginx.conf /etc/nginx/conf.d/default.conf
建立 nginx.conf
接著,編寫 nginx.conf 設定文件來啟用 Nginx 的狀態頁面,這將暴露供 Prometheus 爬取:
server {
    listen 80;  # 使用本地端口
    server_name localhost;  # 設定為 localhost

    location /nginx_status {
        stub_status on;  # 啟用狀態模組
        access_log off;
        allow all;  # 允許所有 IP 訪問
    }
}
建置並啟動容器
使用以下命令建置 Docker 映像並啟動容器:
docker build -t my-nginx:latest .
docker run -d -p 8881:80 --name nginx-prometheus-exporter my-nginx:latest
訪問 Nginx 狀態頁面
啟動容器後,訪問 http://localhost:8881/nginx_status,你會看到類似以下的頁面:
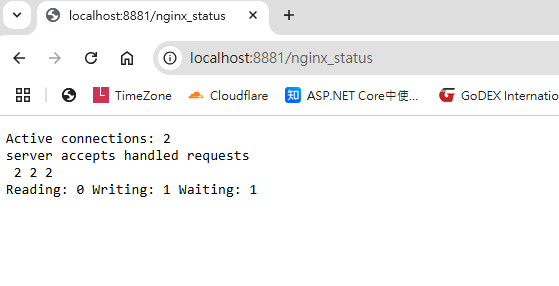
Nginx 狀態資訊
Active connections: 2
目前有 2 個活動連線。
server accepts handled requests: 2 2 2
- 2:已接受的連線數。
- 2:已成功處理的連線數。
- 2:總請求數(可能大於連線數,因為每個連線可以處理多個請求)。
Reading: 0 Writing: 1 Waiting: 1
- Reading: 0:正在讀取請求的連線數。
- Writing: 1:正在傳送響應的連線數。
- Waiting: 1:空閒等待新請求的連線數(使用 HTTP Keep-Alive)。
P.S.當前伺服器負載較輕,共有 2 個連線,其中 1 個正在處理請求,1 個處於等待新請求的狀態。
容器應用說明
grafana ( 報表呈現 ) > prometheus-exporter ( 主動爬取資料 ) > nginx/nginx-prometheus-exporter (將這些數據暴露給 Prometheus的工具 ) > nginx status ( 網站服務器,提供網頁伺服器的狀態 )
建立及啟動相關容器應用
刪除先前的測試容器,接下來,我們建立 deployment.yaml 文件來部署包含所有服務的 Docker 容器。
deployment.yaml 範例
version: "3.8"
services:
  mynginx:
    build: ./nginx/
    container_name: mynginx
    ports:
      - 8885:80

  nginx-prometheus-exporter:
    image: nginx/nginx-prometheus-exporter
    container_name: nginx-prometheus-exporter
    command: -nginx.scrape-uri http://nginx:80/nginx_status
    ports:
      - 9113:9113
    depends_on:
      - nginx

  prometheus:
    image: prom/prometheus:v2.35.0
    container_name: prometheus
    volumes:
      - ./prometheus.yaml:/etc/prometheus/prometheus.yaml
      - ./prometheus_data:/prometheus
    command:
      - "--config.file=/etc/prometheus/prometheus.yaml"
    ports:
      - "9090:9090"

  renderer:
    image: grafana/grafana-image-renderer
    environment:
      BROWSER_TZ: Asia/Taipei
    ports:
      - "8082:8081"

  grafana:
    image: grafana/grafana
    container_name: grafana
    volumes:
      - ./grafana_data:/var/lib/grafana
    environment:
      GF_SECURITY_ADMIN_PASSWORD: pass
      GF_RENDERING_SERVER_URL: http://renderer:8082/render
      GF_RENDERING_CALLBACK_URL: http://grafana:3007/
      GF_LOG_FILTERS: rendering:debug
    depends_on:
      - prometheus
      - renderer
    ports:
      - "3007:3000"
設置 Prometheus 設定
編寫 prometheus.yaml 來設定 Prometheus 如何抓取數據。
global:
  scrape_interval: 5s  # 設定抓取頻率
  external_labels:
    monitor: "my-monitor"

scrape_configs:
  - job_name: "prometheus"
    static_configs:
      - targets: ["localhost:9090"]
  - job_name: "nginx_exporter"
    static_configs:
      - targets: ["nginx-prometheus-exporter:9113"]
使用 Docker Compose 啟動容器服務:
docker-compose -f ./deployment.yaml up -d
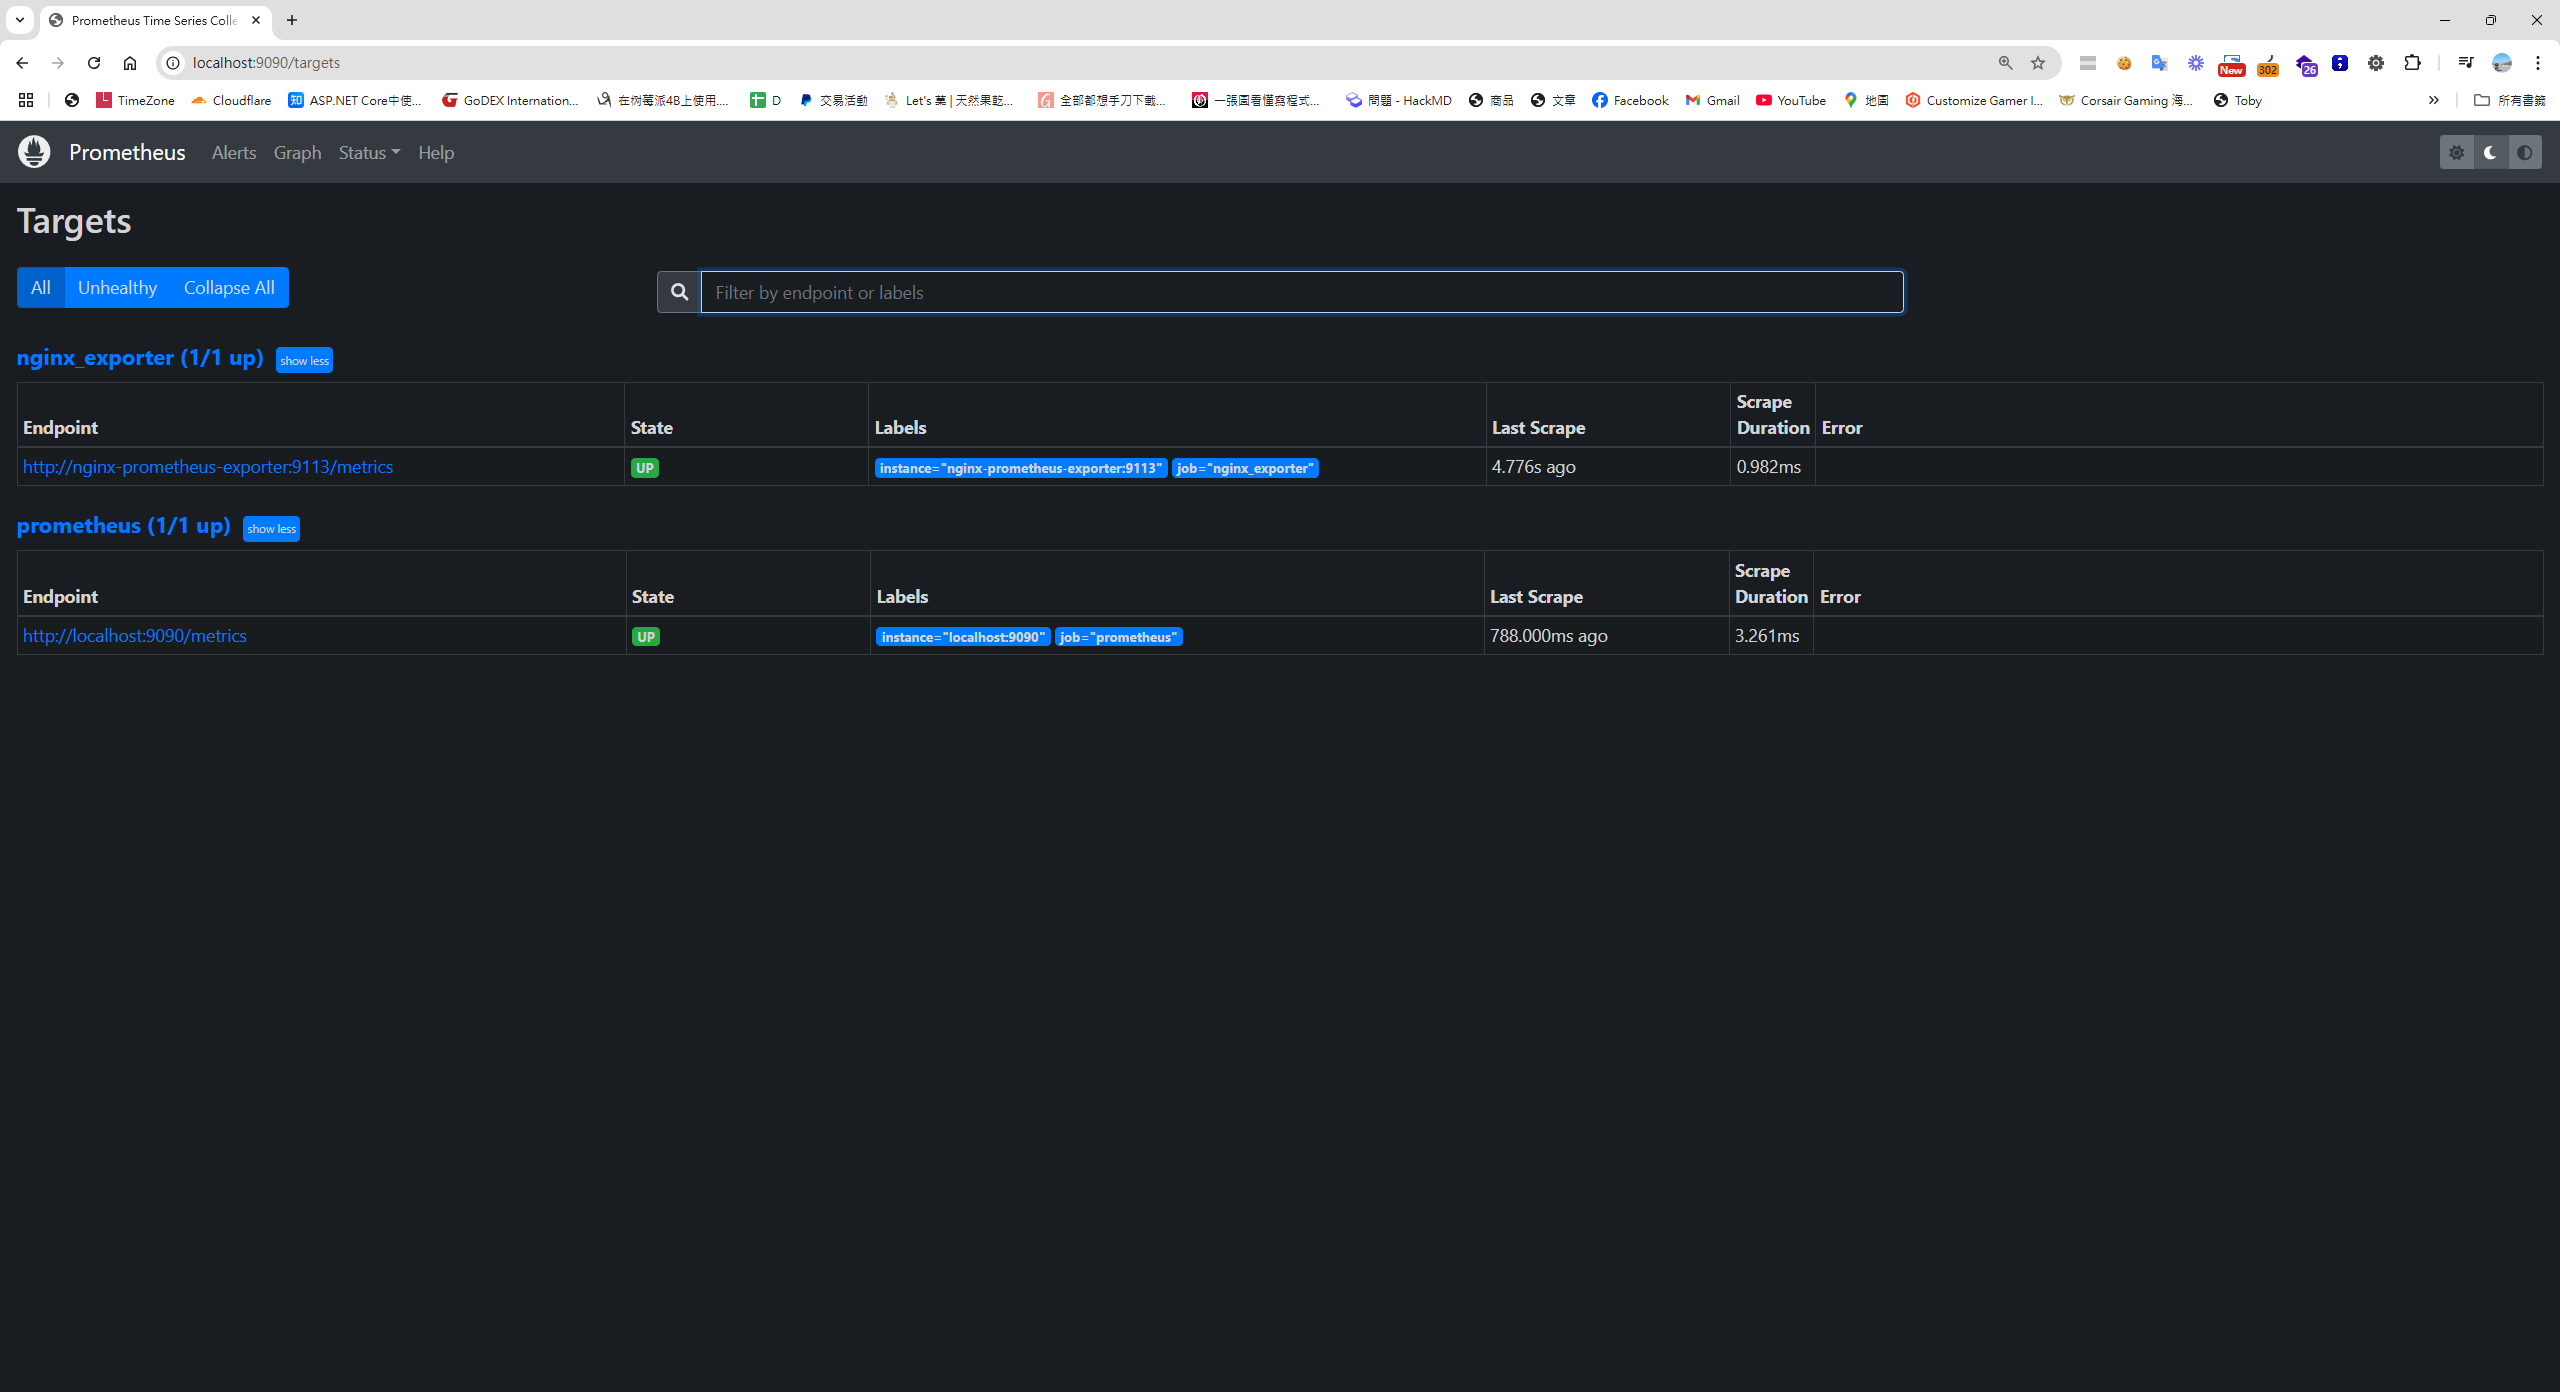
查看 Prometheus Targets
在瀏覽器中打開 http://localhost:9090/targets,你可以查看 Prometheus 採集器的目標狀態。
使用 Prometheus 繪製 Nginx 指標圖表
切換 Prometheus 的 Graph 頁籤,搜尋nginx,可以根據 Nginx 的指標繪製即時圖表:
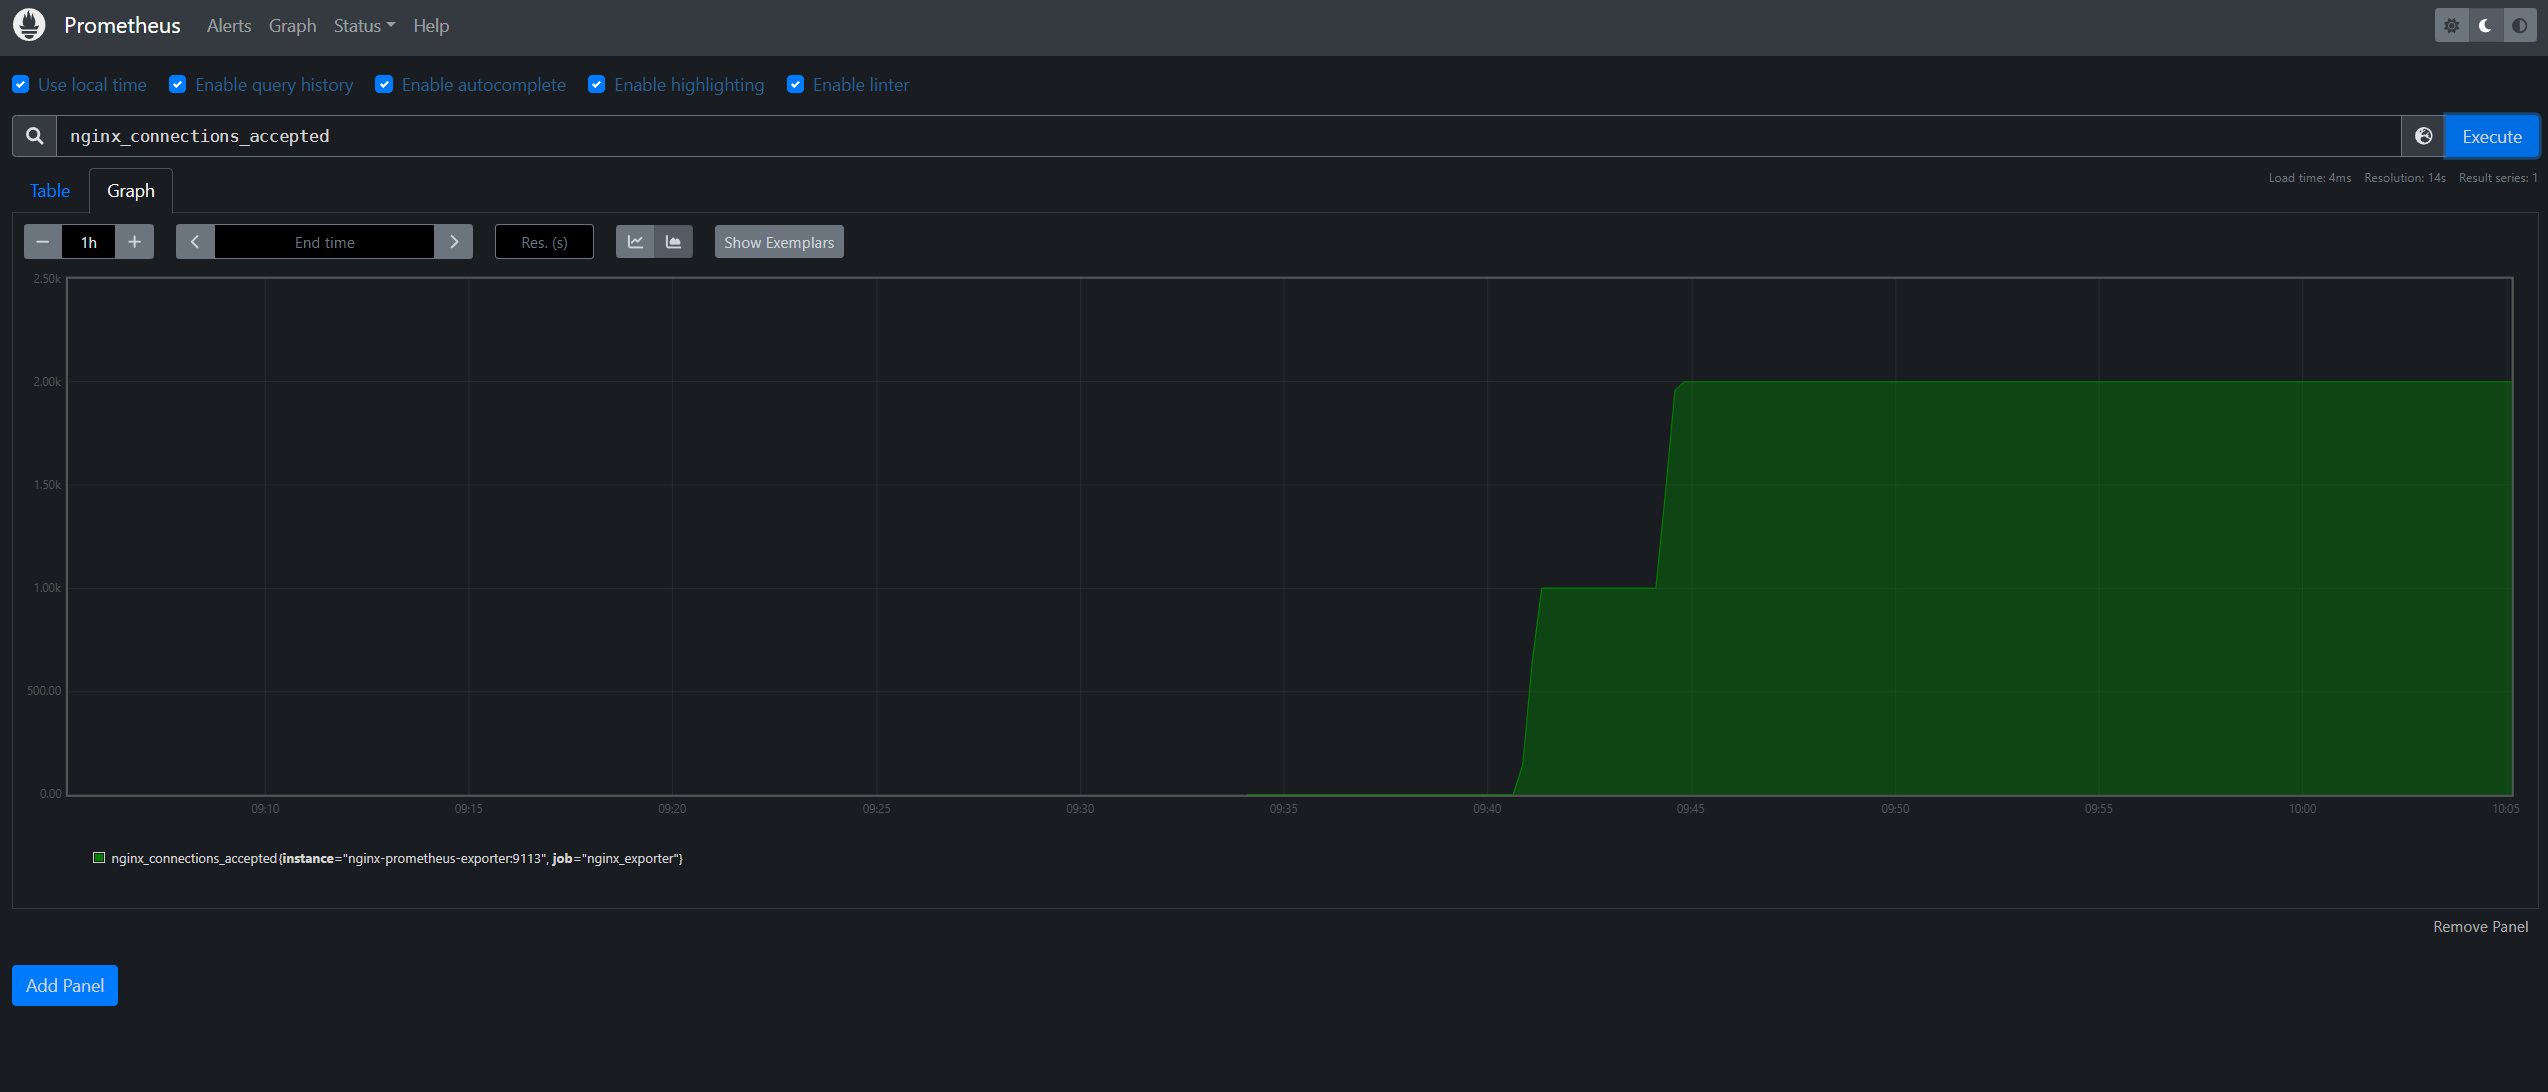
然而,Prometheus 的報表較為簡單。如果你需要更精美的圖表或更多篩選選項,可以使用 Grafana 來展示。
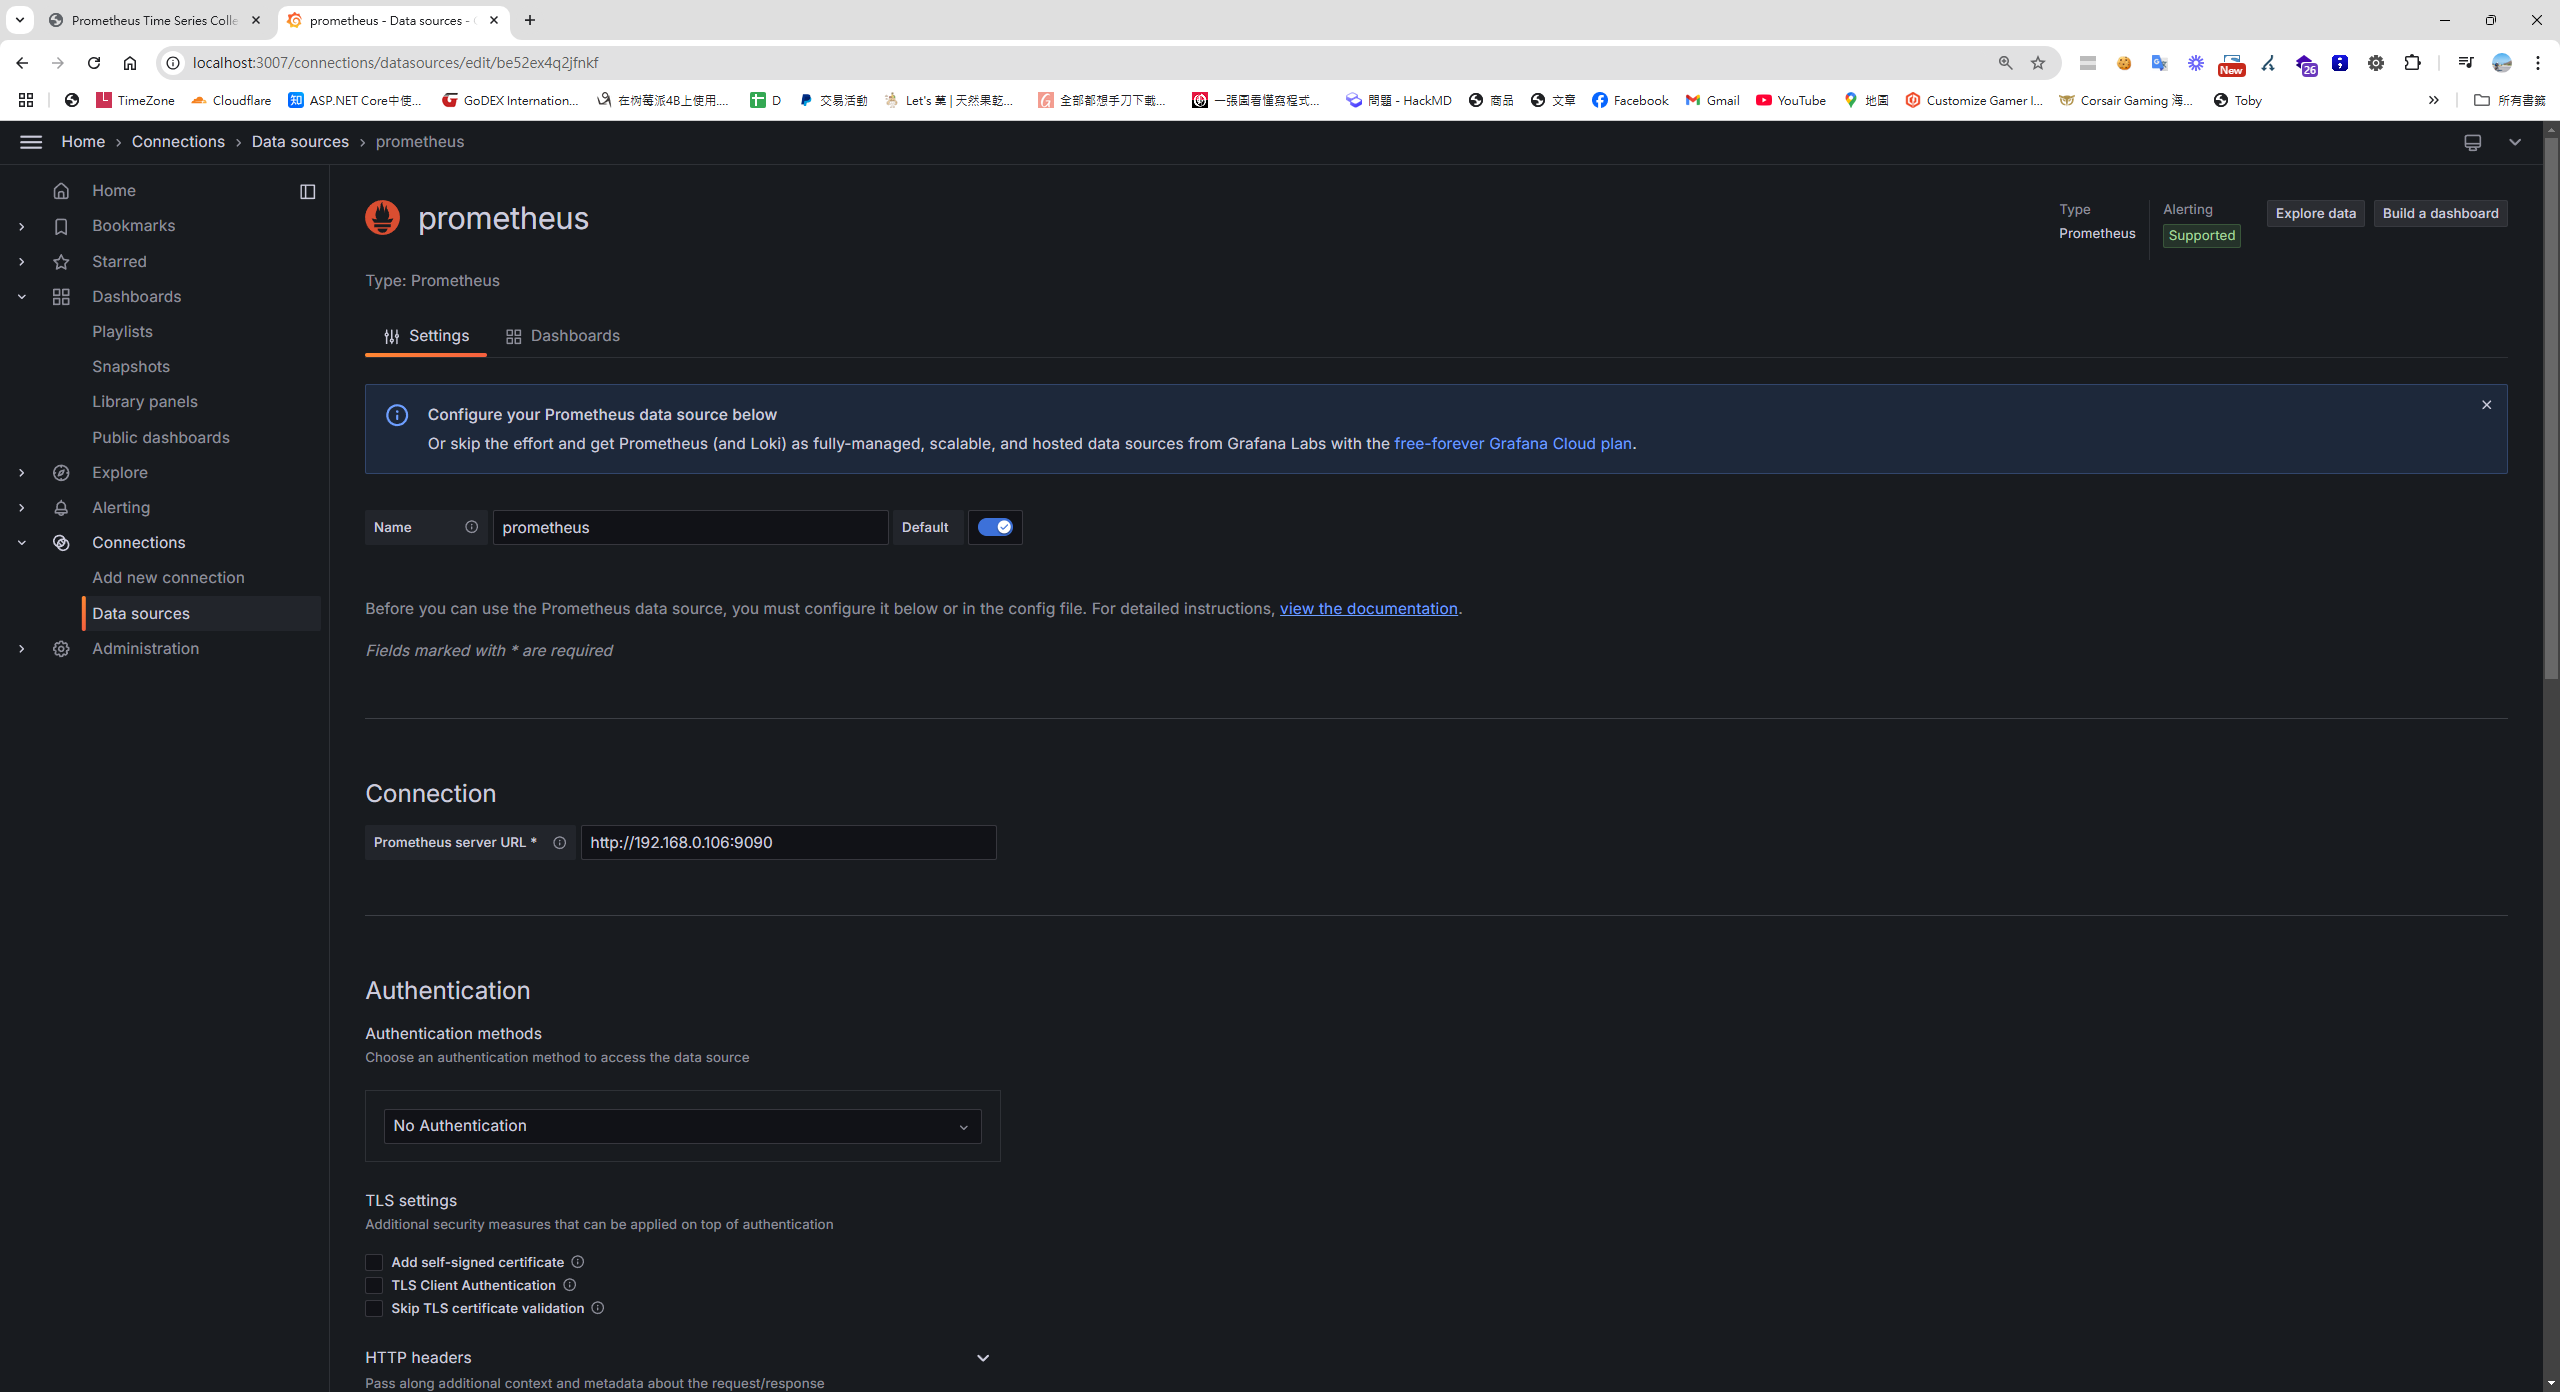
設定 Grafana 連接 Prometheus
- 打開 Grafana 儀表板(http://localhost:3007/)。
- 進入 "Connection" 部分,點擊 "Add new connection" 並選擇 "Prometheus"。
建立 Grafana Dashboard
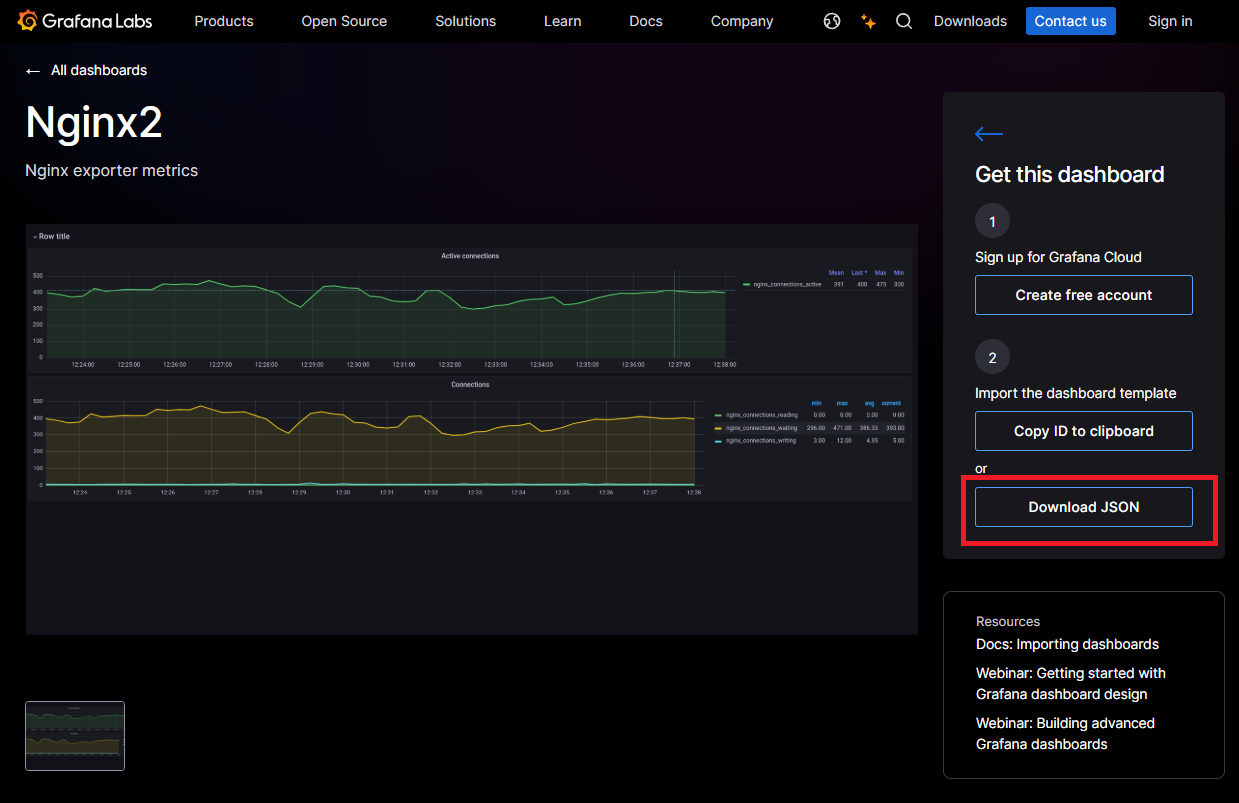
你可以從 Grafana Dashboard 市集下載現成的模板,來展示 Nginx 的指標。
下載 Dashboard 範本
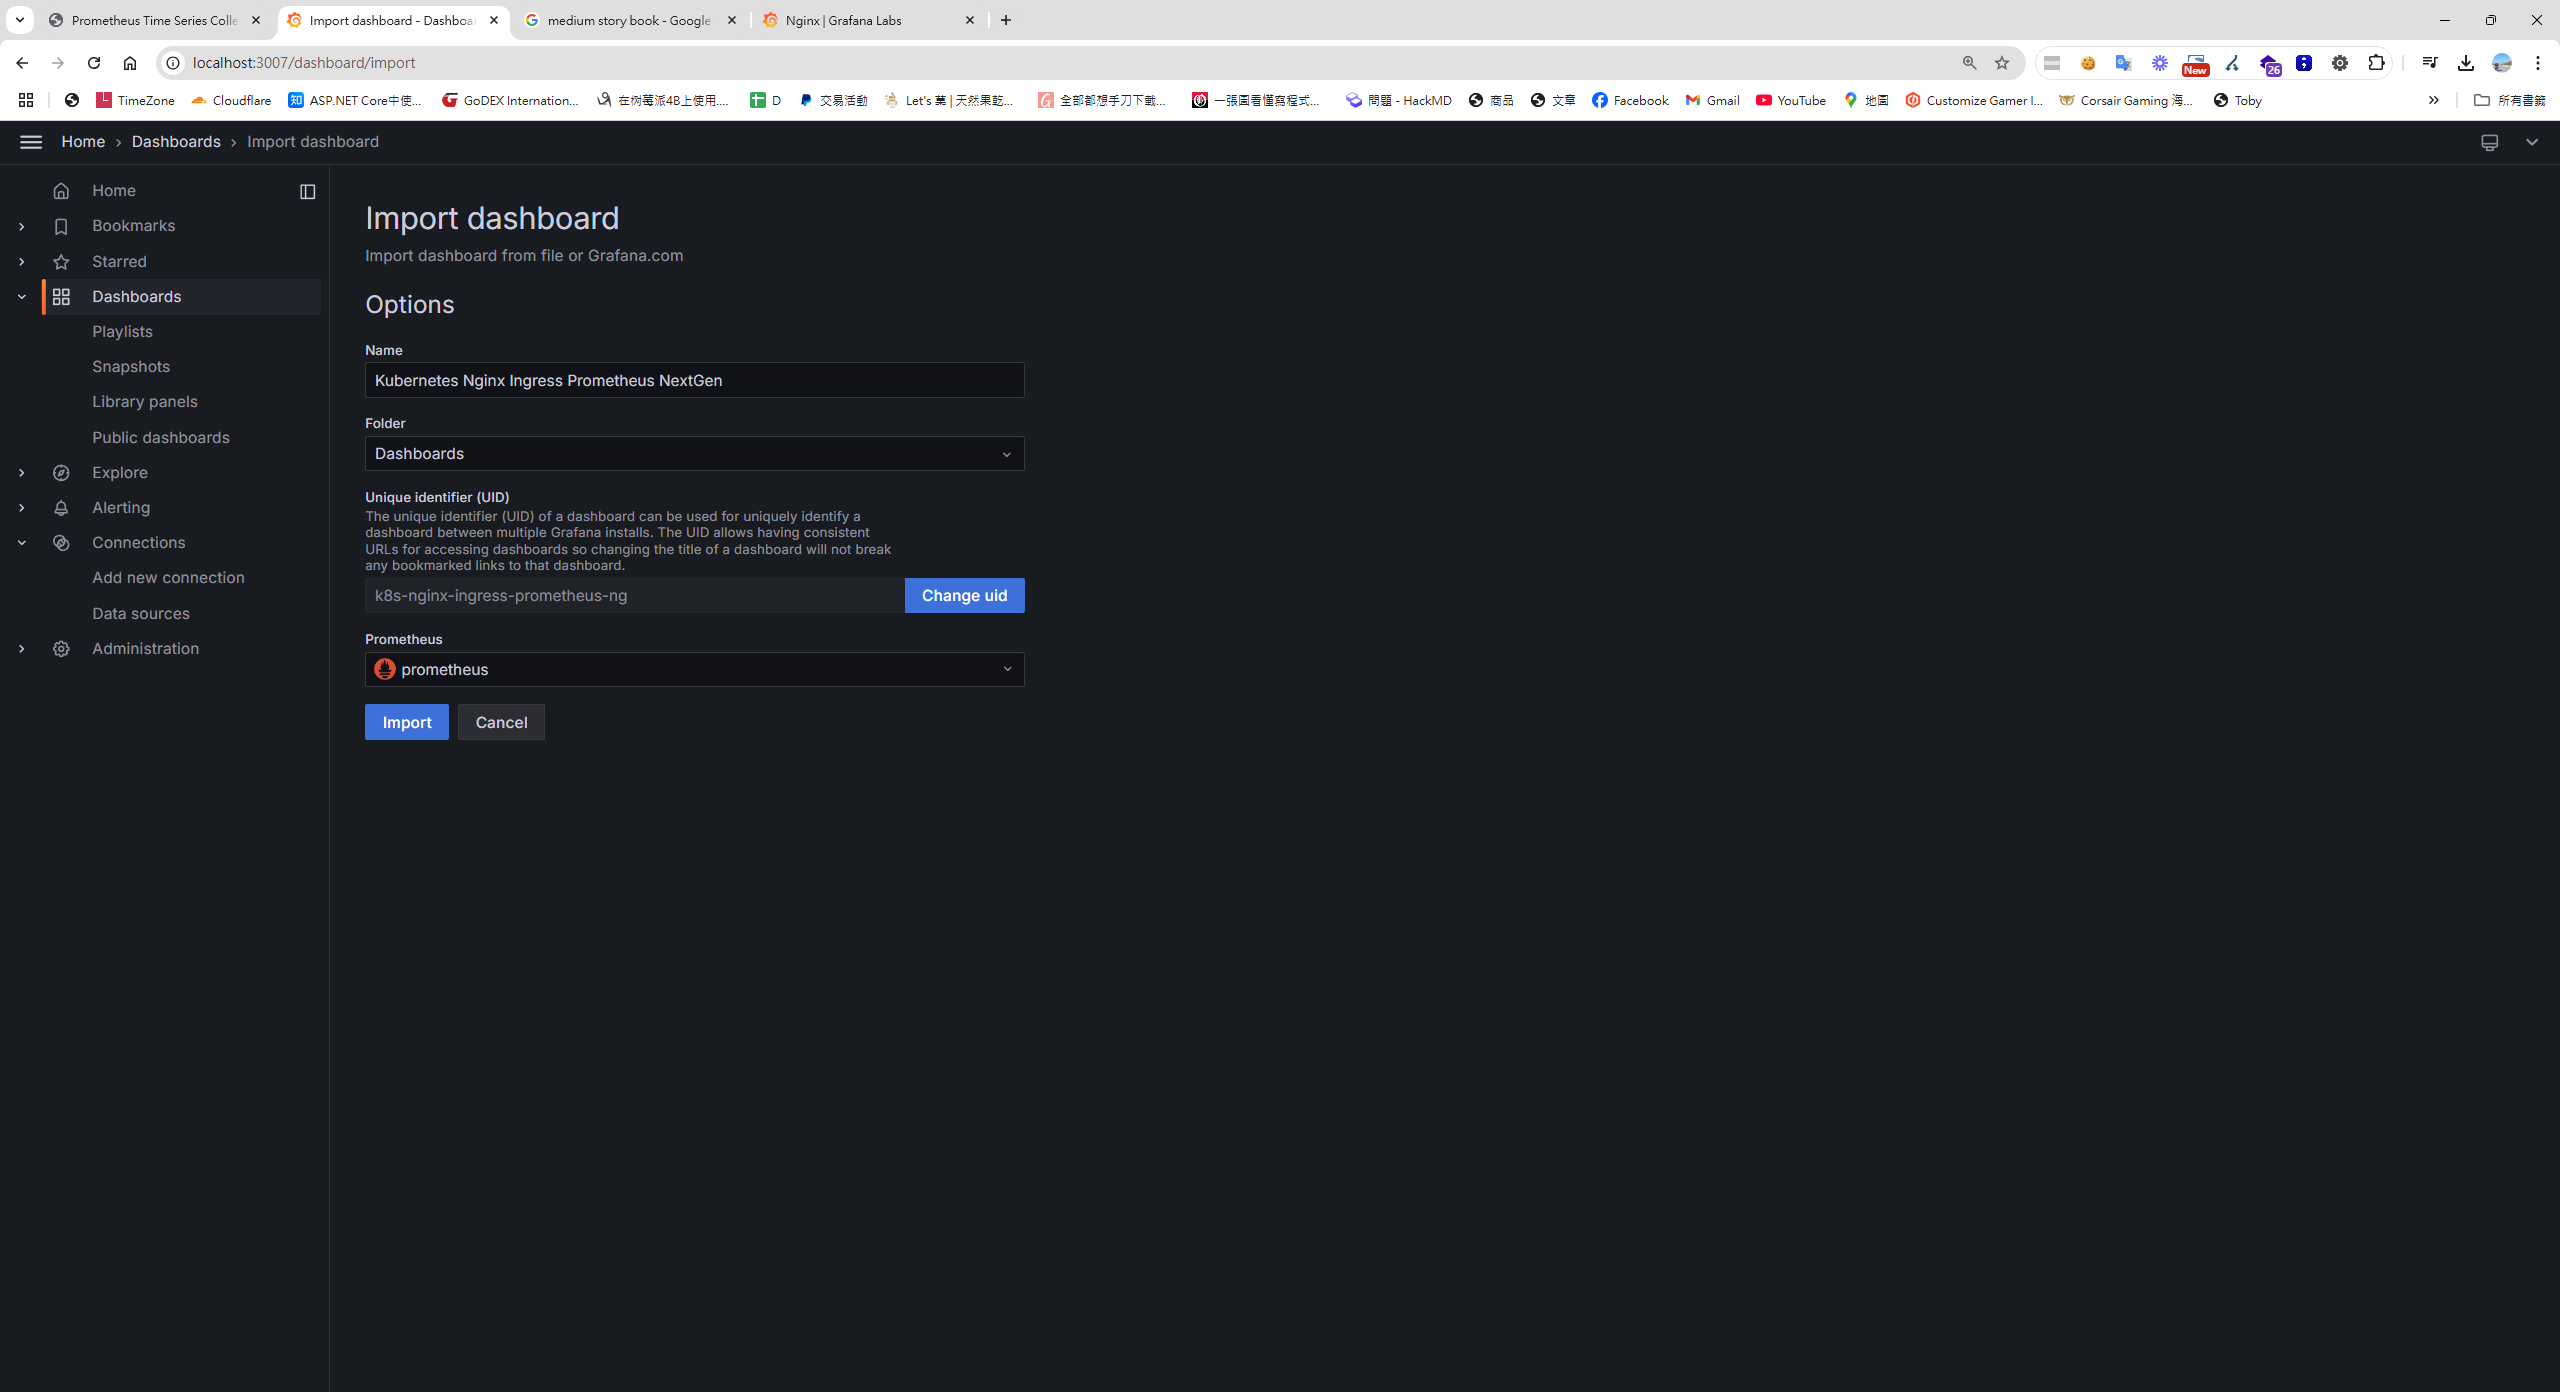
匯入 Dashboard 模板
回到 Grafana 儀表板,點擊 "New Import" 並導入你下載的 JSON 模板。
執行 K6 壓測
撰寫 K6 壓力測試腳本,模擬流量並驗證 Nginx 性能:
import http from 'k6/http';
import { check, sleep } from 'k6';

export const options = {
  stages: [
    { duration: '30s', target: 3000 },  // 負載測試從 0 到 3000 個虛擬使用者,持續 30 秒
    { duration: '1m30s', target: 3000 }, // 維持 3000 個虛擬使用者,持續 1 分 30 秒
    { duration: '20s', target: 0 },      // 減少虛擬使用者數量
  ]
};

export default function () {
  const res = http.get('http://192.168.0.88:8885/nginx_status'); // your nginx ip
  check(res, { 'status was 200': (r) => r.status == 200 });
  sleep(1);
}
使用 Docker 版本的 K6,無需額外安裝,直接執行壓力測試:
// Windows 腳本
cat script.js | docker run --rm -i grafana/k6 run -
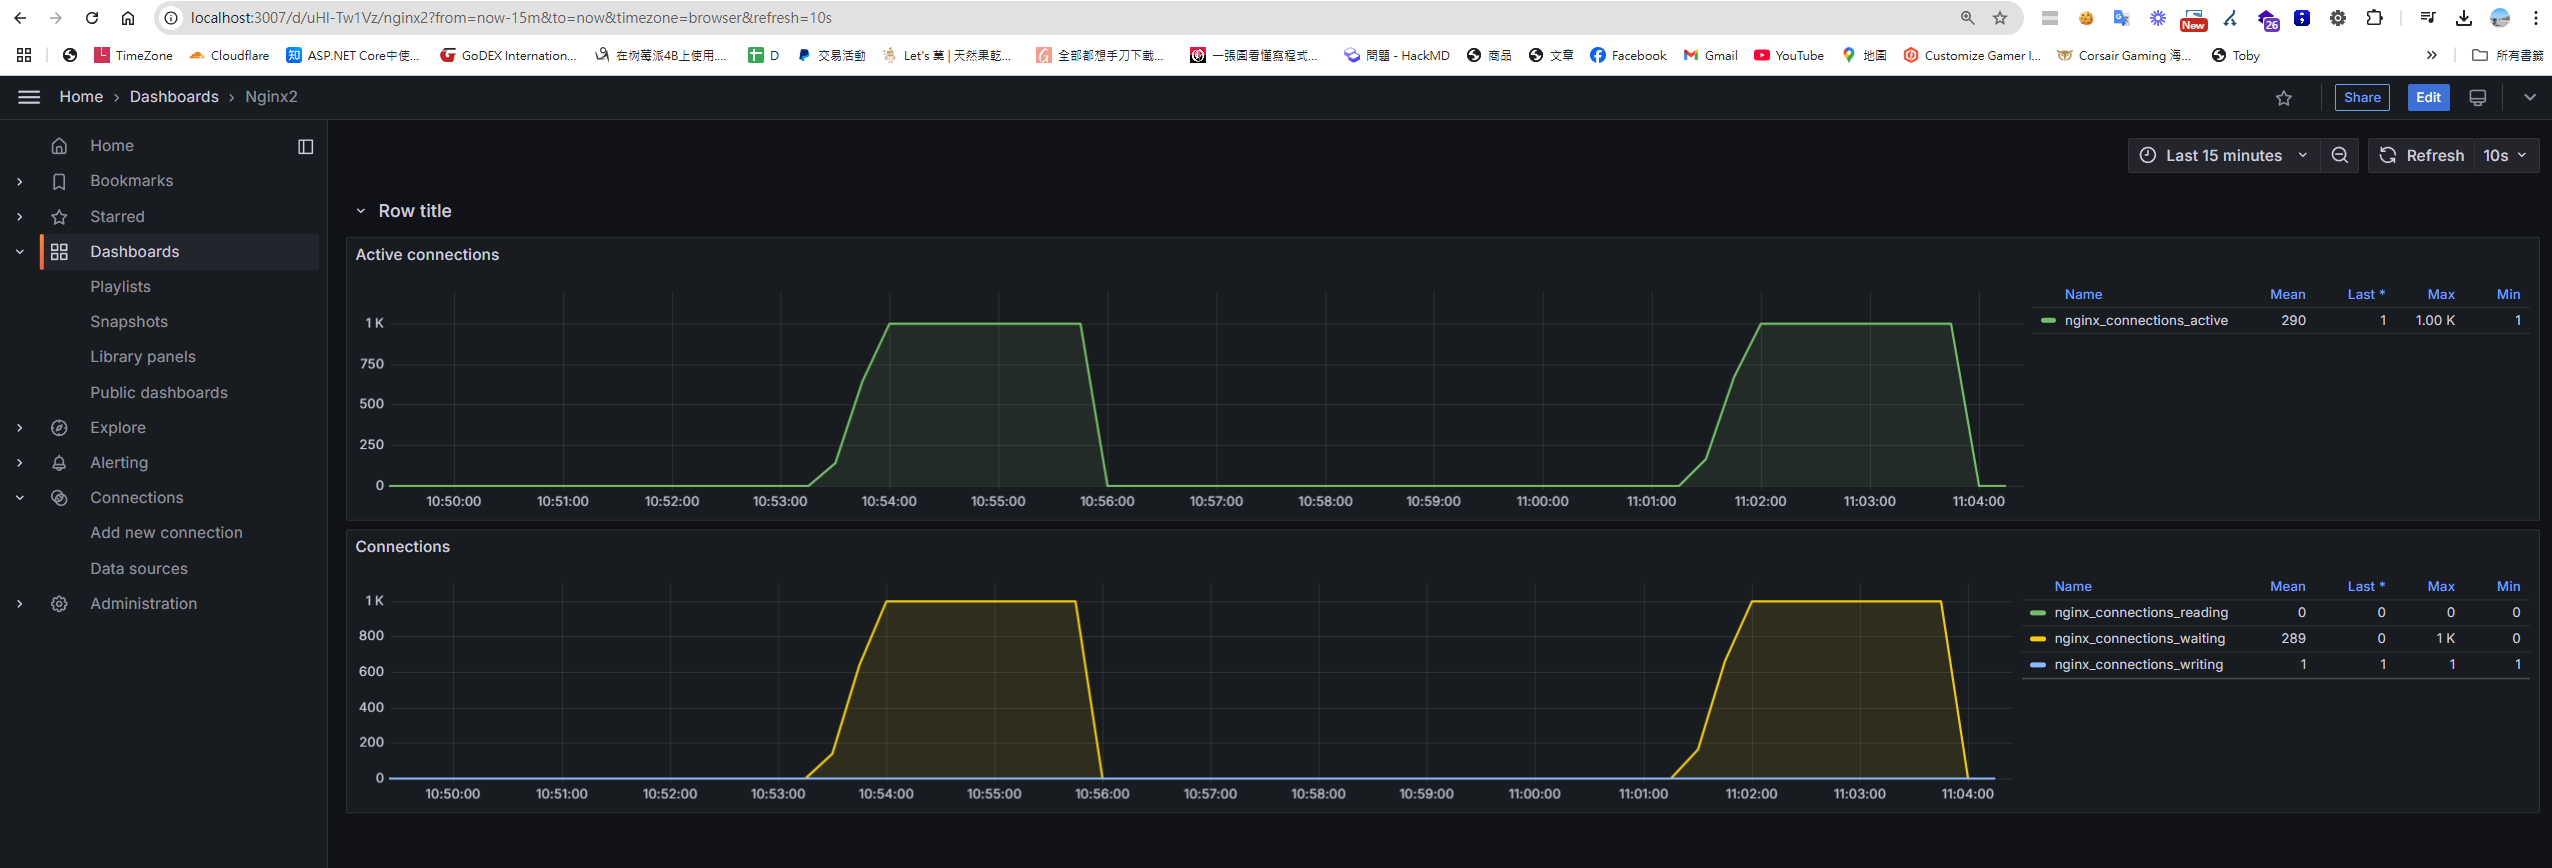
查看 Grafana 儀表板上的即時數據
進行壓力測試後,Grafana 儀表板將即時顯示 Nginx 的連線數量等指標。
相關程式碼
所有程式碼和設定檔都可以在 GitHub Repo 上找到。


留言